
Volume Profile Indicator for MT5: How to see the market through volume
Most novice traders only look at candlesticks. They analyze highs, lows, trend lines and indicators, but often do not ask the main question:at what prices did the market really show interest?
This is what the Volume Profile Indicator for MT5 helps to solve.
Unlike the usual volumetric indicator, which shows activity over time, Volume Profile distributes volume by price levels. Horizontal histograms appear on the chart, allowing you to see where the most transactions took place, and where the price moved almost without stopping.
This makes the indicator useful for searching:
strong support and resistance levels;
accumulation and distribution zones;
potential turning points;
levels for entry after rollback;
targets in the breakdown of the range;
areas where price may slow or accelerate.
Volume Profile is especially interesting for traders who work with gold, silver, currency pairs, indices and other liquid instruments.
What is Volume Profile in simple words
The usual volume answers the question:when was the market active?
Volume Profile answers another question:where exactly did the main trading activity take place at the price?
Imagine that the price moved between the two levels for several hours. During this time, market participants made a large number of transactions. If you build a distribution of volume by price, you will see where the main interest is concentrated.
Such areas often become important landmarks for future movement.
On the chart:
long horizontal bars show levels with high trading activity;
short bands indicate areas where the volume was lower;
the most significant level of the profile can be used as a benchmark to find a market balance;
empty or low-liquid areas often move faster because the price meets fewer counter bids.
The indicator does not predict movement automatically. Its task is different: to help the trader understand the structure of the market and not make decisions blindly.
How the Volume Profile Indicator works in MetaTrader 5
The presented indicator builds a volumetric profile for the selected time range. In the settings you can define the analysis period, the number of profiles, the construction step and the method of displaying the data.
Using the indicator settings as an example, the following parameters are available:
Range period: 1 Day;
Range count: 20;
Time shift:no offset;
Mode step: 100 points;
Point scale: ×10;
Volume type: Tick volume;
Data source: M1 bars;
Bar style: Line;
Draw direction: Left to right;
Line width: 1;
Mode color: Blue;
Median & VWAP line style: Dot.
This configuration allows you to analyze the distribution of activity within daily ranges. If necessary, a trader can change settings for scalping, intraday trading, or more relaxed analysis.
It is important to consider that MetaTrader 5 uses exactlytick-volume. It shows the number of price changes over a certain period, rather than the total exchange volume. Therefore, the profile should be perceived as a tool for analyzing activity and liquidity, and not as an absolute map of all market transactions.
How to read the volume profile on a chart
1. High volume zones
On the graph they appear as wide horizontal sections of the profile.
These are areas where price spent a lot of time and where there was active exchange of positions between buyers and sellers.
These levels can be:
support during descent;
resistance during growth;
consolidation zone;
a guideline for taking profits.
If price returns to an area of high volume, the reaction may be stronger than in an area where trading activity was minimal.
2. Low volume zones
Areas with little volume are often located between large clusters.
If the price leaves the balance zone and moves through an area of low activity, the movement may accelerate. That is why it is useful to take such areas into account when searching for targets after a breakout.
However, low volume does not automatically mean a buy or sell signal.It just shows that price historically has not stayed in a particular range for long.
3. POC and central levels
POC, or Point of Control, is one of the most well-known concepts in volumetric analysis. This is the level around which the maximum volume for the selected period was concentrated.
Traders use it as:
benchmark for determining market balance;
potential price return area;
breakdown confirmation level;
additional filter for transactions.
In practice, it is better not to use POC separately. Its value increases if it coincides with the previous high, low, opening level of the day or other technical zone.
Example of work on XAUUSD
The first chart shows the Volume Profile on XAUUSD gold with the M15 timeframe.
The indicator displays several daily profiles located to the left of the price movement. Each profile shows the distribution of activity within a separate period.
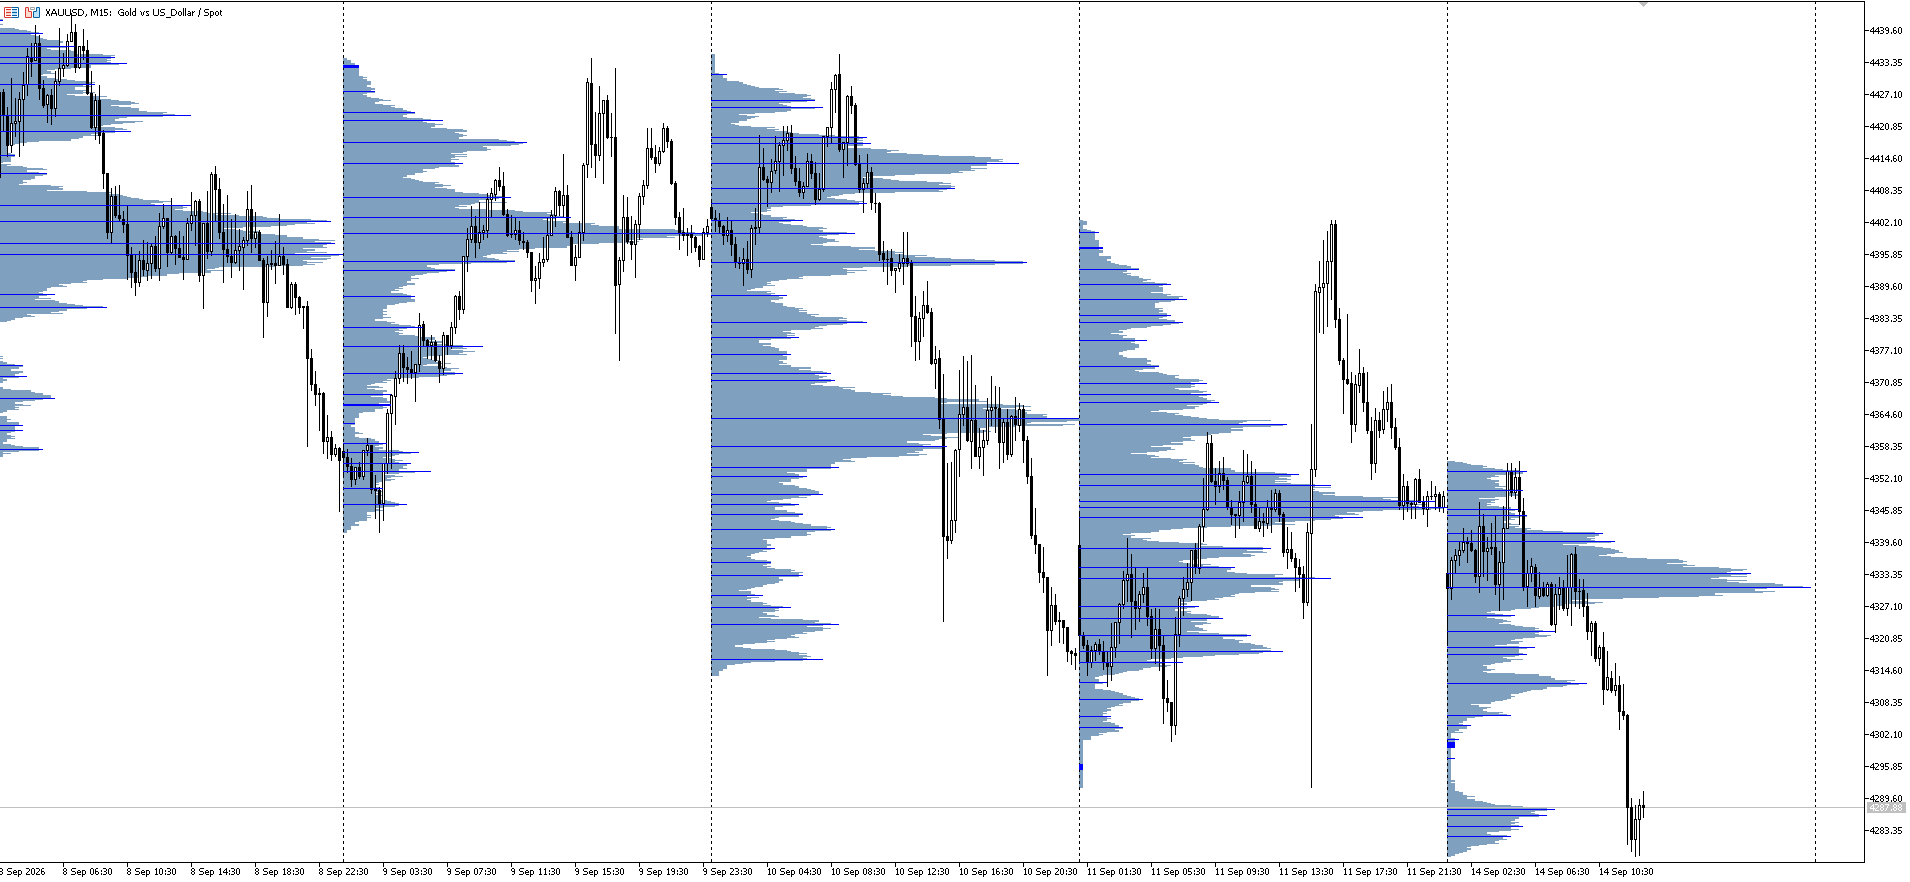
Volume Profile Indicator on the XAUUSD gold chart, M15 timeframe.
The chart clearly shows that the price has repeatedly returned to areas where high volume had previously formed. At the same time, some areas with a small amount of trading activity were completed faster.
This analysis helps the trader determine in advance:
where the price may meet resistance;
where the decline is likely to stop;
what areas can be considered for searching for a deal;
where is it more logical to place a protective stop loss;
what levels can become targets as the movement continues.
It is especially useful to compare the current price with several previous profiles. If the same level has repeatedly attracted market participants, it may remain significant in the future.
Pexample of working on XAGUSD
The second example shows the indicator on silver XAGUSD, timeframe M5.
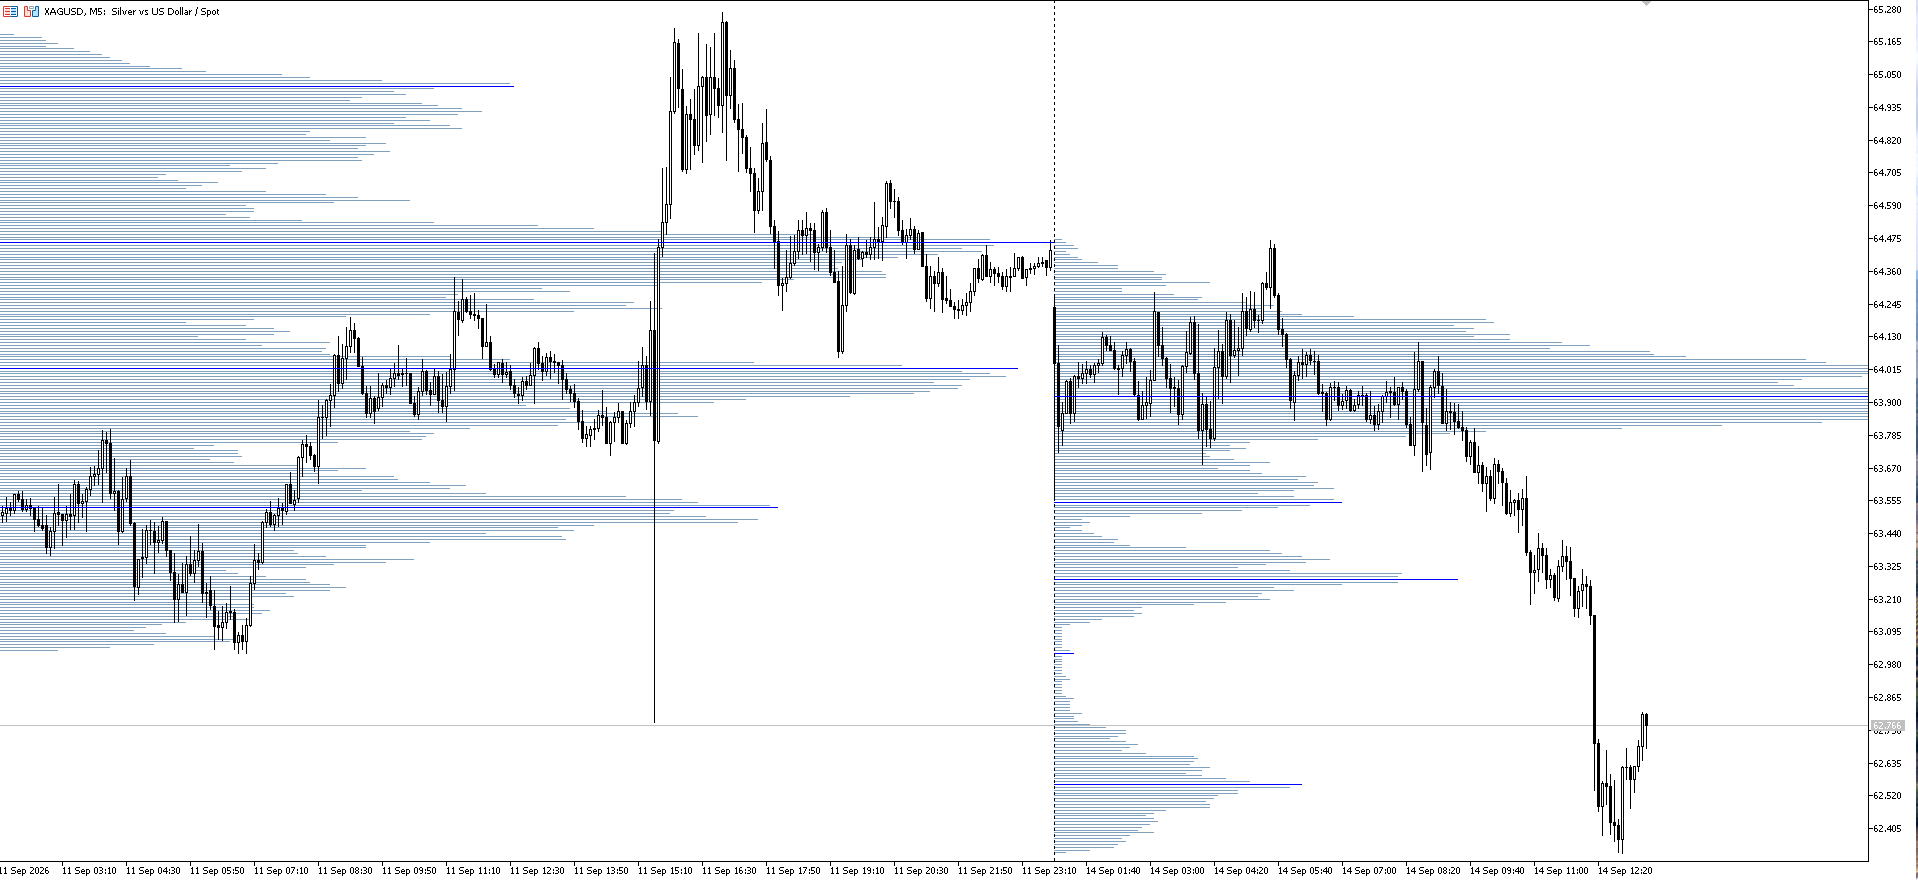
Volumetric profile on XAGUSD M5 silver showing areas of increased trading activity.
On a lower timeframe, the profile helps to examine intraday movements in more detail. This is especially true for scalpers and traders who work inside trading sessions.
For example, if price, after an impulse, returns to an area where there was previously high volume, a trader can evaluate the market reaction:
buyers maintain the level;
sellers defend the resistance area;
the price is fixed within the range;
a breakdown occurs and a transition to a new value zone occurs.
The main advantage of this approach is that the trader sees not only the direction of the candles, but also the context in which the movement was formed.
How to Use Volume Profile to Find Inputs
The indicator can be used in several scenarios.
Buy from a high volume zone
If the price declines to an area where there was previously active trading, you can wait for confirmation of the buyers' reaction.
Confirmation can be:
reversal candle;
formation of a local minimum;
return price above the level;
increase in activity after a rollback.
The profile itself is not a signal to buy. It shows an area where price action is worth taking a closer look at.
Selling from the resistance zone
If price rises toward a dense volume cluster and begins to slow down, a trader may consider a correction or reversal scenario.
Additional factors may include:
previous high;
descending market structure;
weak impulse;
false breakout;
confirmation on a higher timeframe.
Breakout trading
One of the interesting scenarios occurs when the price leaves the balance zone.
If the market has been in an area of high volume for a long time and then confidently leaves it, the price may head towards the next significant profile.
In this case, Volume Profile helps determine:
range boundaries;
nearest areas of interest;
potential targets;
areas where traffic may speed up.
Which indicators should Volume Profile be combined with?
To obtain a better analysis, Volume Profile can be used in conjunction with other tools.
VWAP
VWAP shows the weighted average price taking into account volume. The combination of VWAP and Volume Profile allows you to compare the current price with the intraday average price and historical activity zones.
Support and resistance
Classic horizontal levels complement the volumetric profile well. If the technical level coincides with a high volume area, attention to such an area becomes higher.
Price Action
Candlestick patterns help assess the market reaction within the found area.
Moving averages
Moving Average can be used to determine the general direction of movement. In this case, Volume Profile helps to look for entry points along the trend, rather than trying to trade every reversal zone.
Advantages of the indicator
Shows volume not only by time, but also by price levels.
Helps to find support and resistance zones.
Simplifies market balance analysis.
Suitable for gold, silver, Forex and other instruments.
Can be used on different timeframes.
Useful for scalping, intraday and swing trading.
Allows you to compare the current price with historical areas of activity.
Does not overload the chart with a large number of individual signals.
Limitations
Volume Profile does not guarantee a price reversal and does not indicate the direction of future movement. The same level can be broken during a strong impulse or news movement.
It is also necessary to remember that the profile is based on historical data. Past trading activity does not mean that market participants will necessarily defend the same level in the future.
Therefore, it is better to use the indicator as part of a trading system, and not as an independent signal generator.
How to download Volume Profile Indicator for MT5
If you want to test the indicator on your own MetaTrader 5 chart, download it from the link below:
DOWNLOAD VOLUME PROFILE INDICATOR FOR MT5
After installation, it is recommended to test the operation of the tool on a demo account and select settings for the selected asset and trading style.
Where to practice volumetric analysis
Volume Profile is especially useful for traders who want to gain a deeper understanding of price action and look for trades beyond just candlestick patterns.
You can practice working with the indicator in the MT5 terminal, using a convenient trading infrastructureAvora Markets.
Main conclusion
Volume Profile Indicator for MT5 helps you see what is not always noticeable on a regular chart. It showswhere the market was actually trading actively, and where the price passed with minimal resistance.
Using a volume profile allows you to structure technical analysis, find important price areas and prepare scenarios for entry, exit and risk management in advance.
When properly combined with VWAP, support and resistance levels, Price Action and trend analysis, Volume Profile becomes a useful tool for more informed trading.