
Supertrend Indicator for MT5: how the indicator works and what settings to use
Most trend indicators try to answer one question:where is the market heading now?
Supertrend does this as visually as possible. A dynamic line appears on the chart, which is located below the price during an upward movement and above the price during a downward trend. When the price crosses the line, the indicator changes direction.
But Supertrend's simplicity can be deceiving.
The indicator does not predict the future price and does not know where the trend will end.His task is much more practical:help structure the movement that is already taking place, taking into account current volatility.
Supertrend is based on the Average True Range - ATR, that is, an indicator of the price movement range. Therefore, the distance between the price and the indicator line changes along with market volatility.
Let's look at how Supertrend works in MT5, what its settings mean, how to read a change in direction and why the indicator is especially useful in pronounced trend movements.
Briefly about the main thing
Supertrend:trend indicator based on ATR
Period: 10
Multiplier: 3.0
Main function:visual determination of trend direction and dynamic level
Strength:trend movements
Main limitation:sideways market and frequent false switches
What is Supertrend Indicator?
Supertrend is a trend indicator that uses ATR to determine the distance between price and a dynamic line.
Its principle is quite simple.
When the market is in an upward movement, the Supertrend is located below the price and acts as a dynamic support guide.
When the market goes into a downward movement, the line appears above the price and becomes a dynamic resistance reference.
This is why the indicator is convenient to read even without complex calculations:
line below the price - ascending mode;
line above the price - downward mode;
a change in the position of the line is a possible change in direction.
Supertrend was developed as a trend following tool and has become widely used due to its combination of visual simplicity and volatility calculations.
How is Supertrend calculated?
The indicator is based on two components:
ATRandMultiplier.
First, two basic boundaries around the average price of the candle are calculated:
Upper Band = (High + Low) / 2 + Multiplier × ATR
Lower Band = (High + Low) / 2 − Multiplier × ATR
The algorithm then determines which boundary should be used as the current Supertrend line. In ascending mode, the lower bound is used, and in descending mode, the upper bound is used.
This is an important point.
Supertrend is not just a Moving Average, which the price constantly crosses above and below.
The indicator takes into accountmarket volatility.
If the market becomes more volatile, the ATR increases and the distance to the Supertrend line becomes greater.
If the movement becomes calmer, the ATR decreases and the line moves closer to the price.
As a result, the same indicator can look completely different in a calm foreign exchange market and in a sharply moving gold market.
Which Supertrend settings to use in MT5?
Your indicator configuration uses three main parameters:
Period — 10
Multiplier — 3.0
Show as DRAW_FILLING — true
What does Period mean?
Period determines the number of periods used when calculating ATR.
When value10the indicator uses ATR with a period of 10.
The shorter period makes the calculation more sensitive to recent changes in volatility.
A higher period makes the indicator's reaction smoother.
Therefore, changing Period affects not only the appearance of the line, but also the speed of its reaction to changing market conditions.
What does Multiplier mean?
Multiplier determines how far the Supertrend boundaries are from the base price.
When value3.0a distance of three ATR values is used.
Increasing the Multiplier makes the line further away from the price. As a result, the indicator usually switches less frequently.
Decreasing the Multiplier brings the line closer to the price and makes it more sensitive to movements.
That is, a classic compromise arises here:
higher sensitivity → more switching
lower sensitivity → less switching
However, one cannot automatically assume that fewer signals means higher quality. The optimal parameters depend on the instrument, time frame and market mode.
What does DRAW_FILLING do?
In the provided configuration the parameterShow as DRAW_FILLING is set to true.
It is responsible for visually displaying the area between the price and the indicator line.
That is why colored zones appear on the chart, which make the direction of movement more noticeable.
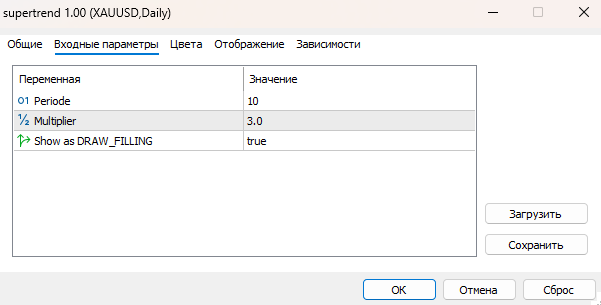
Supertrend Indicator settings in MetaTrader 5: Period = 10, Multiplier = 3.0, Show as DRAW_FILLING = true.
How to read Supertrend on a chart?
Supertrend's greatest strength is its visual simplicity.
Let's imagine an uptrend.
The price gradually makes higher highs and lows. Supertrend is below the price and rises with the market movement.
If the movement continues, the line gradually moves higher.
At a certain point, the price closes below the line.
Then the indicator switches to the opposite mode and begins to appear above the price.
This can be seen assignal of change in the current market regime, but not as a guarantee of a reversal.
This is where it is important to distinguish between two concepts:
Supertrend change ≠ guaranteed market reversal.
The indicator reacts to a price movement that has already occurred. Therefore, it can switch after a significant portion of the movement.
Supertrend on EUR/USD: what the trend mode looks like
The EUR/USD H4 chart clearly shows why Supertrend is especially useful for visually analyzing directional movements.
In the growth phase, the price remains above the green zone, and the line gradually rises along with the market.
Then the structure changes.
The price begins to decline, the Supertrend switches above the market, and then the line accompanies the downward movement.
The main idea of the indicator is clearly visible here:it does not try to predict the turn in advance, but helps to visually determine which mode of movement has already formed.
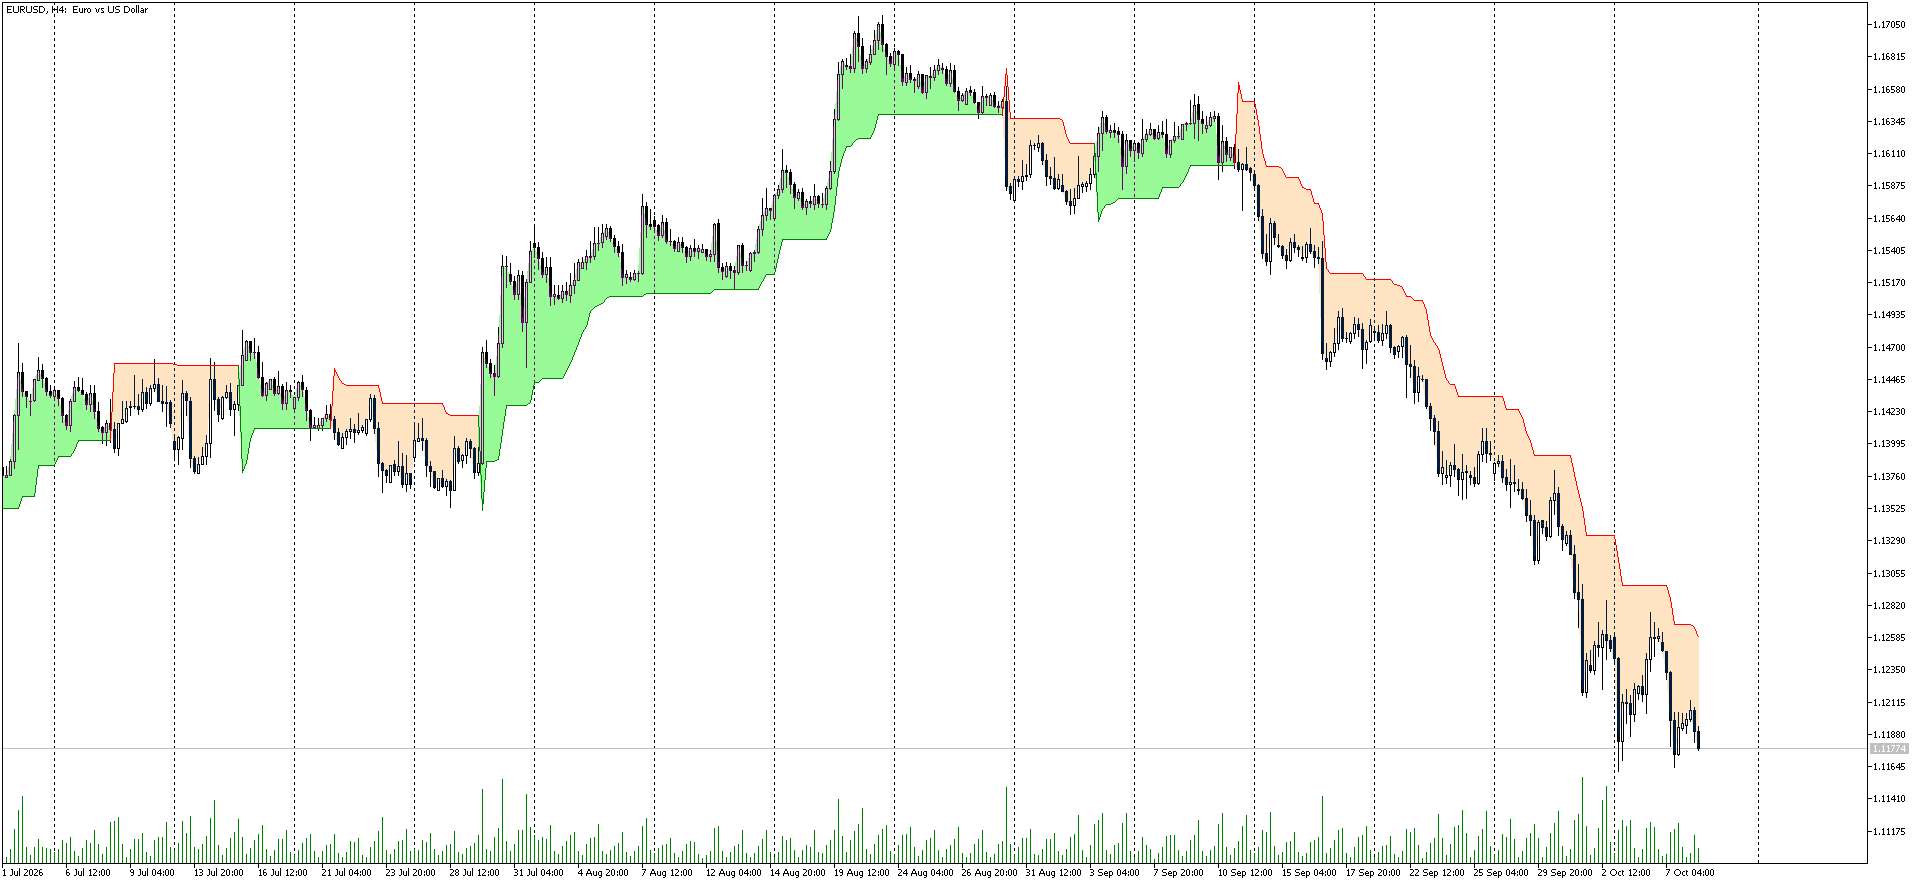
Supertrend on EUR/USD H4: the indicator visually accompanies the successive phases of upward and downward movement.
Why does Supertrend work better in trends?
The problem with most trend-following indicators is the same market mode - flat.
When price moves directionally, Supertrend has room to work.
The price stays on one side of the line for a long time, and the indicator does not switch with every small fluctuation.
But if the market begins to move in a narrow range, the situation changes.
The price crosses the line several times.
Supertrend starts to switch:
green → red → green → red
And the trader receives a large number of signals that do not necessarily correspond to full-fledged trend movements.
This is one of the fundamental features of trend-following systems: they usually do better where there is actual movement, and worse where the market does not have a stable direction.
Therefore, it is more logical to consider Supertrend asmarket regime determination tool, and not as a stand-alone signal generator.
Supertrend on gold: why settings cannot be transferred mechanically
Gold is a good example of why one set of parameters does not necessarily behave the same in different markets.
On XAU/USD, the range of price movements can vary significantly from period to period. Because Supertrend uses ATR, the line automatically takes into account changes in volatility.
Several different phases are clearly visible on the daily gold chart:
long upward movement;
sudden acceleration;
transition to descending mode;
subsequent corrections;
new change of direction.
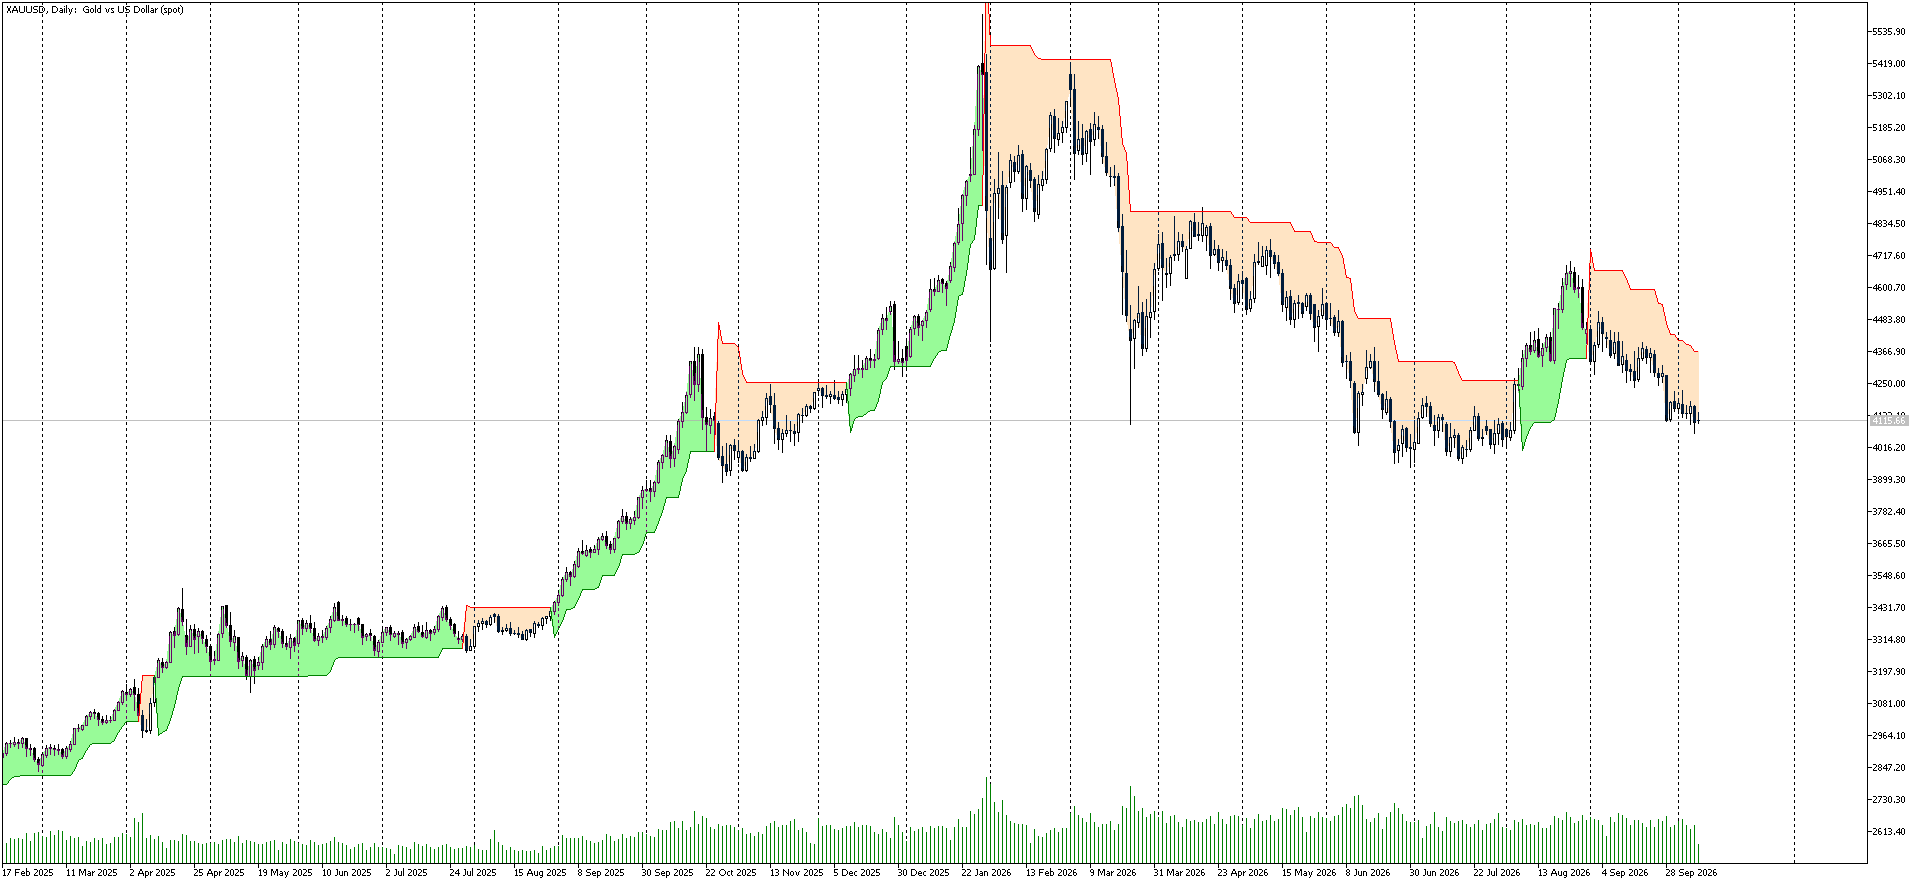
Supertrend on the XAU/USD daily chart: different market modes and changes in the direction of the indicator along with the price structure.
Do I need to change Period and Multiplier?
There is no universal value that will be optimal for any instrument.
Settings10 / 3are a common Supertrend configuration, but this does not mean that these are the parameters that should be used in every trading system.
Changing parameters only makes sense if it is clearwhat problem is the trader trying to solve?.
For example:
If there are too many signals
You can explore a longer Period or a larger Multiplier.
The logic here is simple: the line becomes less sensitive to small fluctuations.
If the indicator is too slow
You can test a smaller Period or a smaller Multiplier.
But the price for higher sensitivity is potentially more false switches.
Main mistake
You shouldn't optimize Supertrend just to make the historical chart look perfect.
A setting that perfectly describes past movement may be significantly less useful with new data.
Therefore, it is more reasonable to check the parameters on several instruments, time frames and individual historical periods.
Supertrend as a dynamic level
Supertrend has another important feature.
A line can be used not only to determine direction, but also as a dynamic reference.
During an upward movement, the line is located below the price.
During a downward period, it is higher.
Therefore, a trader can use it as an additional point of control:
whether the current market regime is maintained;
how far the price is from the dynamic level;
whether there was a closure on the other side of the line;
whether the movement is confirmed by the price structure.
But here it is important not to turn the indicator into a mechanical rule.
Supertrend shows one element of the market picture.
He doesn't know:
fundamental context;
future news;
liquidity;
reasons for movement;
future volatility.
Therefore, its usefulness is enhanced when it is used in conjunction with other independent elements of analysis.
Supertrend and signal confirmation
The easiest way to use an indicator is to wait for its direction to change.
But a more structured approach is to view switching asfirst filter, and not as a ready-made sales team.
For example, in a potential upside scenario, you can further evaluate:
structure of highs and lows;
price position relative to key levels;
direction of the higher timeframe;
presence of impulse;
current volatility;
presence of a fundamental event.
This approach is especially important because Supertrend is a lagging trend-following instrument.
If the movement has already begun, the indicator can confirm it only after a certain price change.
How to use Supertrend on multiple timeframes?
One of the most practical options is to split the analysis into two levels.
Senior timeframe
Used to define the general market regime.
For example:
Daily → direction
Junior timeframe
Used to find more precise motion structure.
For example:
H4 → local movement
This approach allows you not to consider each indicator switch on a lower timeframe as a separate independent signal.
If the Daily is showing a downward mode and H4 has temporarily switched up, this may not be the start of a new major trend, but a normal correction.
And vice versa.
Therefore, Supertrend is especially interesting precisely becausemultiframe filter.
What to track now?
When using Supertrend, you should look not only at the color of the indicator itself.
1. Closing the candle
The first thing that is important to monitor is whether the price has actually settled on the other side of the line.
2. Higher timeframe
The signal on H1 or H4 has a different context if Daily is in the opposite mode.
3. Price structure
Higher High/Higher Low and Lower High/Lower Low help to understand whether the Supertrend switching is consistent with the actual market structure.
4. ATR and volatility
Since Supertrend is built on ATR, changes in volatility directly affect the position of the indicator.
5. Market phase
The most important question:
Is the market really trending or in a flat?
If the price constantly returns to one area and crosses the Supertrend several times, the quality of trend-following signals may decrease.
Main conclusion
Supertrend Indicator for MT5 is valuable not because it is able to predict the next price bar.
His strength lies elsewhere.
It turns the complex task of determining the current market mode into a very simple visual signal.
Price above the line - one mode.
Price below the line is another.
At the same time, ATR makes the indicator adaptive to changes in volatility.
SettingsPeriod = 10 and Multiplier = 3.0can be used as a starting point for research, but not as a universal formula for all tools and strategies.
The main thing is to understand what exactly each setting changes and why the indicator can behave completely differently on EUR/USD, gold and other markets.
It is better to think of Supertrend not as a Buy/Sell button, but as a tool for structuring market movement.