
September has traditionally been considered one of the most difficult periods for the US stock market. Decades of data show that it was this month that the S&P 500's negative yields were historically more likely to be positive.
Since 1928, the index has ended September with a decline in about55% of cases. This makes September the only month in the calendar year in which falls have historically occurred more frequently than increases.
The average yield of the S&P 500 in September is about−1,1%.
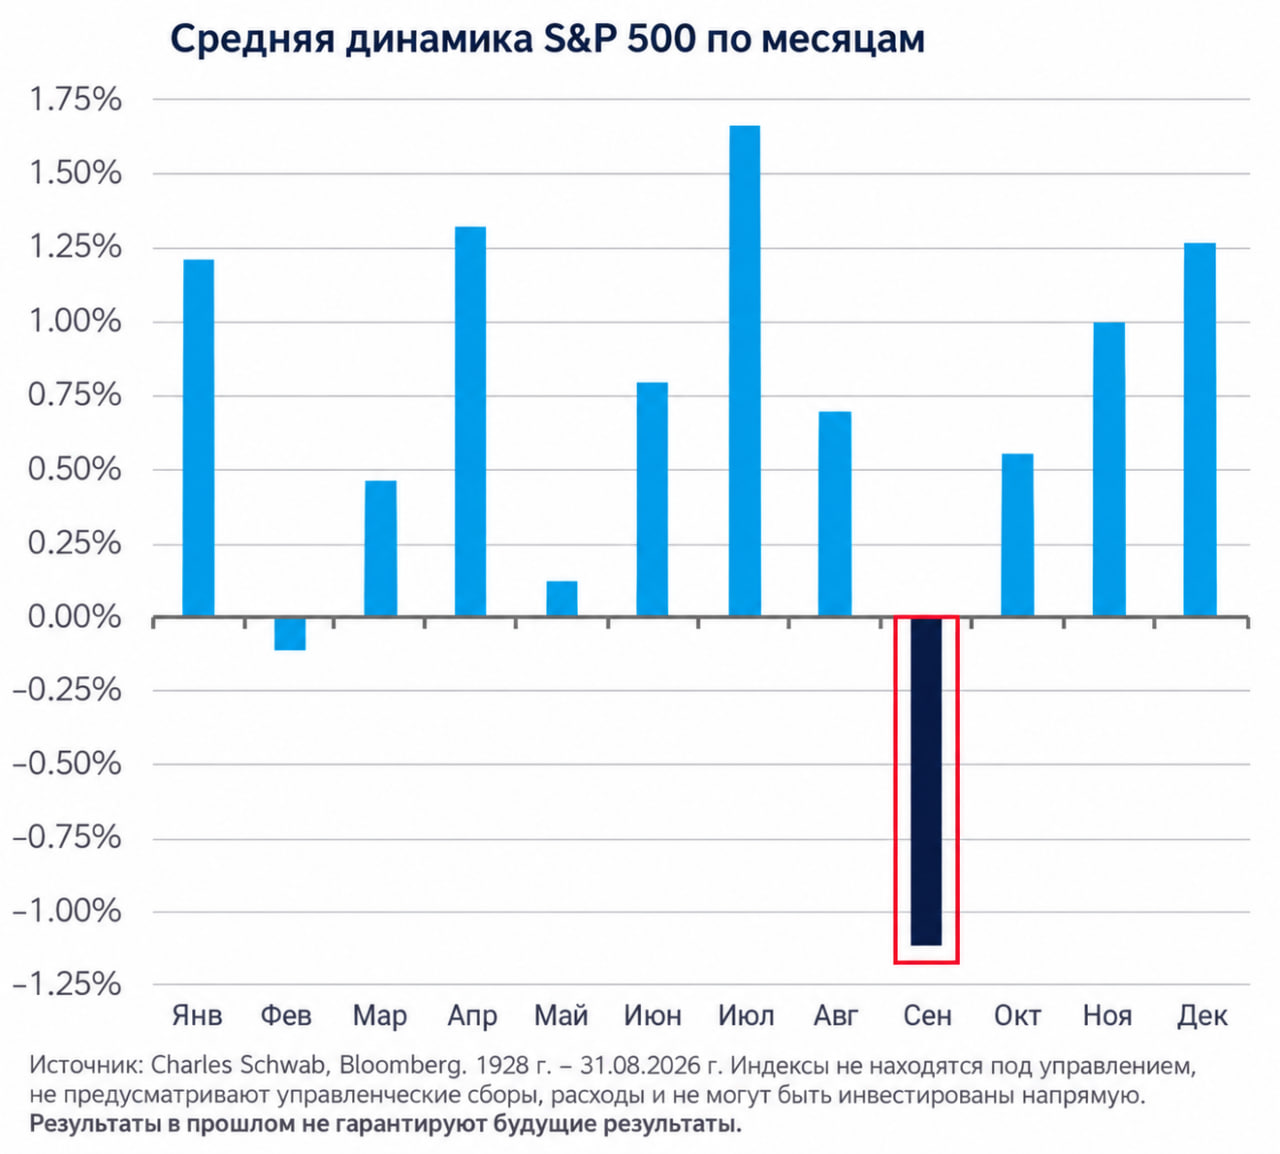
Average dynamics of the S&P 500 by months. Historical data for 1928-2026.
Why September stands out
The seasonality of the stock market is not an independent trading signal, but it allows you to assess how much a certain period has historically differed from the rest.
September is characterized not only by a negative average yield, but also by an increased amplitude of movement.
The average drawdown of the index during the month is about−4,7%. At the same time, the historical range of results remains extremely wide.
The best September brought the S&P 500 around+14,4%while the worst ended with a drop of about−29,9%.
Thus, the statistics do not say that the index must necessarily decline. It rather shows that September is capable of bringing much sharper movements than could be assumed only by the average yield.
The second half of the month is weaker than the first
Another interesting feature manifests itself inside September itself.
Historically, the first half of the month showed an average return of about−0,2%, whereas in the second half the average result was about−0,9%.
It is the last two weeks of September that are the weakest two-week period of the year according to historical statistics.
This is especially important for investors and traders, since the calendar effect is unevenly distributed over the month.
At the same time, we are talking about long-term statistics. An individual year may deviate completely from the historical scenario.
What this means for the market in 2026
The seasonal factor becomes particularly interesting in the current market environment.
US stocks simultaneously react to expectations regarding the Fed's interest rate policy, inflation, the labor market and the dynamics of bond yields.
If macroeconomic data intensify the uncertainty around further Fed decisions, the historically weak seasonality of September may become an additional factor of increased volatility.
However, it would be wrong to use seasonality as an independent basis for selling shares.
History shows the probability of a certain behavior of the market, but does not determine its result.
Volatility is more important than direction
The main conclusion from the September statistics is not that the S&P 500 should necessarily fall.
What is much more important is thatthe risk of strong movements during this period is historically higher, and the distribution of results remains very broad.
Even with a negative average return, the index is able to show strong growth. Conversely, a relatively quiet September can suddenly turn into a large-scale sale.
Therefore, in early September, it is especially important for traders to take into account not only the direction of the index, but also changes in volatility, bond yields and expectations regarding the Fed's policy.
Main conclusion
Historically, September remains the weakest month for the S&P 500.
The index declined around55% of September since 1928, and the average return per month is about−1,1%At the same time, the second half of September historically looks even weaker — about−0,9%an average of two weeks.
This does not mean that in 2026 the market will necessarily repeat the historical scenario.
But against the backdrop of the current uncertainty, seasonality gives traders another factor to consider when assessing the risks and potential movements of American indices.