
The US stock market is expanding: why the S&P 500 recovery doesn't look convincing yet
The US stock market is showing an interesting change: the gap between the largest S&P 500 companies and the rest of the index is starting to shrink.
After a period when the market movement was largely determined by a limited number of the largest companies, more and more shares begin to participate in the overall dynamics. This is reflected in two indicators at once: the convergence of the capitalization-weighted and equilibrium-weighted S&P 500, as well as the recovery of the share of companies trading above their 200-day moving average.
At first glance, this seems to be a positive signal. The more companies support the movement of the index, the less the market depends on a few major players.
However, there is a nuance. The current expansion of the market cannot yet be called a full-fledged bullish signal. The weakness of the AI-related part of the tech sector so far outweighs the growth of companies outside this group.
In other words, the market is getting wider, but the quality of this expansion remains in question.
What's going on with the S&P 500?
To understand what is happening, you need to look at two variants of the same index.
The first is the regular S&P 500, weighted by market capitalization. This means that companies with a higher value occupy a larger share of the index and have a stronger influence on its movement.
The second is the equally weighted S&P 500 (S&P 500 Equal Weight). In it, all 500 companies have the same weight, regardless of the size of the business.
The difference between them helps to determine who exactly provides the movement of the American stock market.
If the regular S&P 500 is growing significantly faster than the equilibrium, this may indicate a concentration of growth in the largest companies.
If the equal-weighted index begins to catch up with the capitalization-weighted index, this indicates a broader participation of companies in market movements.
It is precisely this dynamic that is now becoming more noticeable.
Why does the convergence of two indexes matter?
A narrowing gap between the two versions of the S&P 500 is often seen as a sign of improving Market Breadth.
This indicator answers a fairly simple question: how many stocks actually participate in the movement of the stock market?
Let's imagine two situations.
In the first, the S&P 500 is surging, driven by a few of the biggest tech companies, while much of the rest is little changed or declining.
In the second, growth is distributed much more evenly: companies from different sectors are joining the movement, and most of the index demonstrates positive dynamics.
In both cases, the underlying S&P 500 may post positive returns. But the structure of such growth is fundamentally different.
In the first case, the market depends on a limited number of leaders. In the second, it is supported by a wider group of companies.
Therefore, analysts closely monitor not only the index itself, but also its internal structure.
What does the number of stocks above the 200-day average indicate?
Another important indicator on the chart is the percentage of S&P 500 companies trading above their 200-day moving average.
The 200 day average (200 DMA) is an indicator that shows the average price of an asset over the last 200 trading sessions. It is often used to assess the long-term direction of the market.
If a stock is above this line, it may indicate positive long-term performance. If it's lower, it means continued selling pressure.
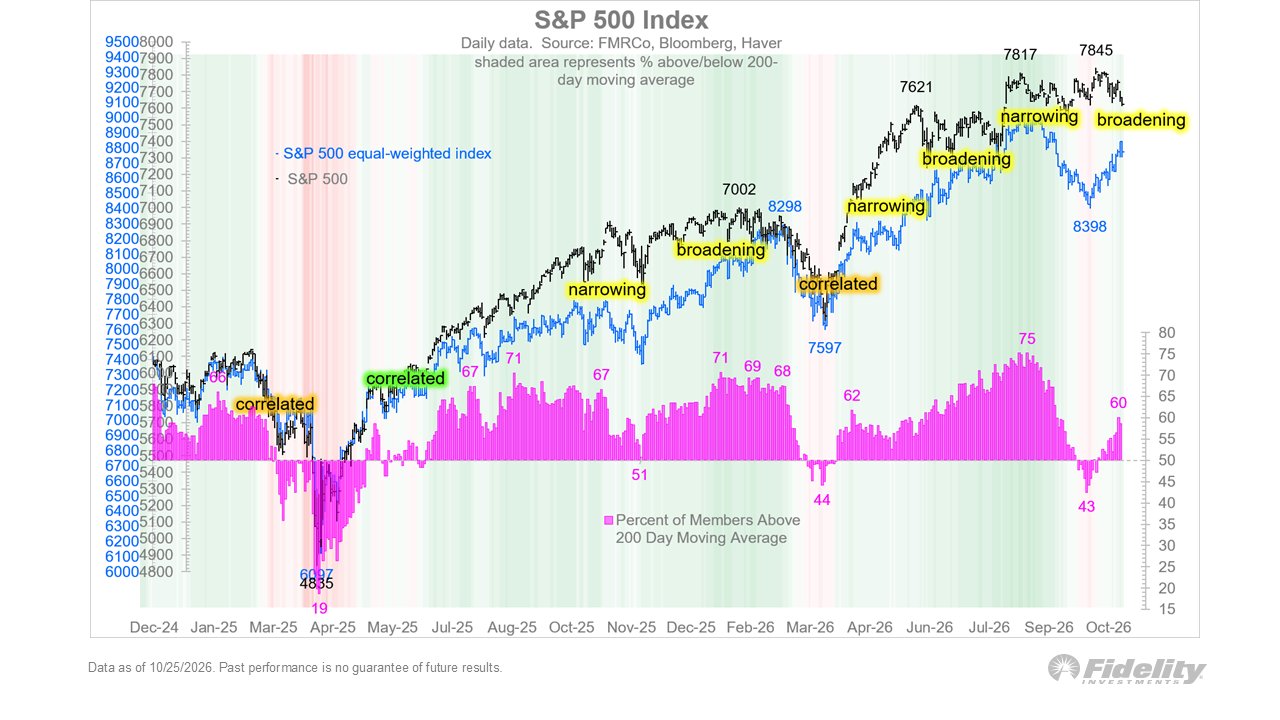
The Fidelity chart shows the percentage of S&P 500 participants that are above their 200 DMA.
Important changes:
In March-April 2025, the figure dropped to around 19%, reflecting extremely weak participation of companies in growth.
At the end of 2025 and the beginning of 2026, the share of companies above 200 DMA was mainly in the region of 65-70%.
In July-September 2026, the figure rose to approximately 75%.
In September, it dropped sharply to about 43%.
By October 25, 2026, the rate had recovered to approximately 60%.
The last movement is especially interesting.
After a noticeable deterioration in market breadth, the share of companies above the long-term average began to increase again.
This suggests that the recovery is not just affecting the largest components of the index.
But 60% is not yet confirmation that the entire market is in a stable upward trend. About 40% of companies are still trading below their 200-day averages.
Why doesn't the current market expansion look bullish yet?
Here is the main nuance of the whole situation.
Market expansion in itself is considered a positive development. However, it is not only the number of growing stocks that is important, but also the reasons why the market structure changes.
In this situation, there are interesting dynamics in the technology sector.
Some artificial intelligence companies are experiencing selling pressure. At the same time, shares outside this group demonstrate more stable dynamics.
But there is a problem: the decline of AI companies is still stronger than the positive contribution of other market participants.
It turns out to be a kind of zero-sum game in relative dynamics: the weakness of one group outweighs the improvement of the situation in the other.
That is why narrowing the gap between the two indices does not mean that the market has received a full-fledged new source of growth.
It is important to distinguish between two processes:
Healthy Market Expansion:More and more companies are growing, while the largest participants also maintain positive dynamics.
Forced market expansion:other companies are beginning to outpace their former leaders, largely because the largest players are losing ground.
The second option does not necessarily mean the beginning of a large-scale correction. But it makes the overall picture less clear.
Why does market concentration remain an important factor?
In recent years, the largest technology companies have gained enormous influence on the dynamics of the American stock market.
The reason lies not only in their size, but also in their significant weight in capitalization-weighted indices.
When a few of the largest companies show strong growth, they can support the entire S&P 500 even when much of the rest is weak.
But there is a downside to this structure.
If the leaders begin to decline, the positive performance of the remaining companies may not be enough to compensate for the losses.
That is why it is important for investors to monitor how sustainable the participation of other companies in the market movement becomes.
If the expansion occurs simultaneously with the recovery of the largest technology companies, the market structure could become significantly healthier.
If the pressure on the previous leaders continues, and the remaining stocks are not able to compensate for their decline, the main index may remain under pressure.
What to track next?
To understand the further dynamics of the American stock market, it is worth paying attention to several indicators.
1. S&P 500 Equal Weight
Shows market dynamics without the dominance of the largest companies.
If the equal-weighted index continues to outperform the regular S&P 500, it will indicate improving market breadth.
2. Share of shares above 200 DMA
One of the most visual indicators of the internal state of the market.
Continued recovery after the decline to 43% will be a positive signal. Repeated deterioration may indicate that the recent expansion was short-lived.
3. Dynamics of the largest technology companies
It is important to understand whether the previous market leaders will be able to stabilize.
A return to positive momentum in this group would help make market expansion more sustainable.
4. Ratio of S&P 500 and S&P 500 Equal Weight
This allows you to assess how much market movement depends on the largest companies.
Continued convergence of indices will indicate a more even distribution of market dynamics.
5. Sustainability of growth outside the AI sector
It is important to monitor whether companies not directly related to artificial intelligence can maintain positive momentum regardless of the behavior of the tech giants.
This is what will help determine whether a truly broad market recovery is taking shape or whether we are seeing a temporary redistribution of capital.
Main conclusion
The US stock market is showing improved breadth, with the gap between the cap-weighted and equal-weighted S&P 500 narrowing and the share of companies above the 200-day average recovering to around 60%.
This is an important change following the sharp deterioration in market structure in September.
However, it is too early to consider what is happening as a full-fledged bullish extension.The pressure on some of the largest technology companies related to AI remains significant, and the positive dynamics of the remaining participants have not yet fully compensated for this weakness.
The big question is not whether the equally weighted S&P 500 can continue to catch up with the main index, but whether both groups of companies can maintain growth at the same time.
The quality of the next stage of the movement of the American stock market will largely depend on this.