
An unusual signal appears on the American market.
Stocks look relatively calm, while gold is showing significantly higher volatility. As a result, the relative volatility of the S&P 500 to gold dropped to0,46.
This level in itself does not mean that a collapse is inevitable.
But it shows something else:
The stock market now assesses risk much more calmly than the gold market.
Why 0.46 matters
The indicator compares260-day volatility of the S&P 500 and gold.
When the reading is high, stocks move more sharply relative to gold.
When it falls, the situation is the opposite.
Now the indicator is around 0.46, that is, the volatility of US stocks relative to gold is unusually low.
It is these extreme values that are historically interesting.
They do not show the direction of the next movement, buthow far the market has deviated from the usual balance of risk.
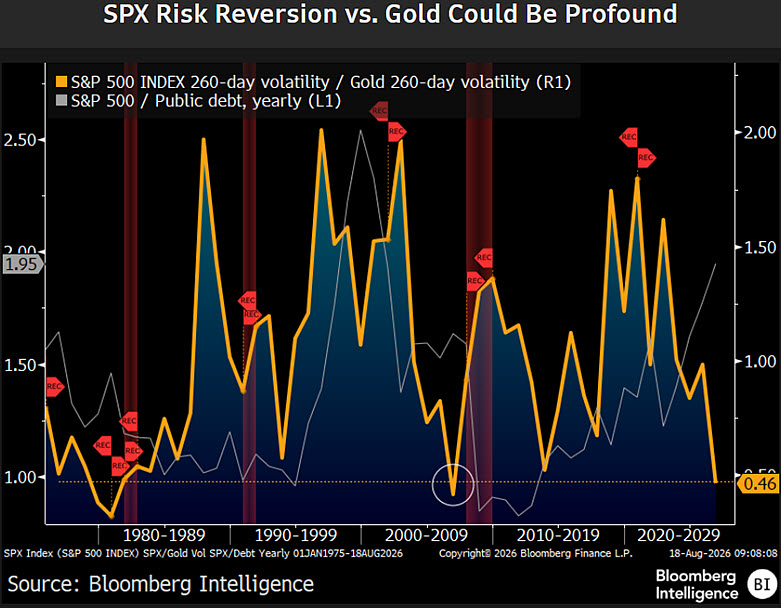
The relationship between S&P 500 260-day volatility and gold. Low readings have historically been accompanied by subsequent increases in volatility. Red zones indicate periods of recession. Source: Bloomberg Intelligence
The market may look calmer than it is
An important point: low volatility does not mean there is no risk.
On the contrary, long periods of calm sometimes create the feeling that the risk has disappeared.
But the risk doesn't go away.
He just might beundervalued at current prices.
At the same time, the fundamental background remains ambiguous: high Treasury yields, fiscal risks, uncertainty around the Fed and high concentration of indices in the largest technology companies create potential sources of sharp movements.
Why is gold especially interesting here?
Gold has traditionally been perceived as a defensive asset, so its increased volatility may reflect completely different market expectations.
The metal is simultaneously affected by interest rates, the dollar, geopolitics and central bank demand.
If these factors begin to move together, gold's volatility could differ significantly from stock volatility.
This is why the SPX/Gold indicator is now giving an interesting signal aboutunusual distribution of risk between two assets.
Main conclusion
Meaning0.46 is not a forecast for a collapse in the S&P 500.
But the extremely low volatility ratio suggests that the stock market is in an area of unusual calm.
If an unexpected macroeconomic or geopolitical factor emerges, volatility could return quickly to historical levels.
The main risk now may not be that the market is already falling, but how little investors are willing to pay for protection against an unexpected move.