
KT Risk Reward Indicator MT5: how to calculate risk/reward directly on the chart
Most traders are accustomed to asking the same question before a trade:
“How much can I earn?”
But another question is much more important:
“How much am I willing to lose for this potential gain?”
This is where the concept comes inRisk/Reward Ratio - the ratio of risk and potential profit.
For example, if a trader is willing to lose $100 and the potential profit in the scenario is $300, the risk/reward ratio will be1:3.
On paper, this calculation seems elementary. In practice, the situation is more complicated: the price changes, the levels have to be moved, and the distance between Entry, Stop Loss and Take Profit is not always convenient to assess visually.
KT Risk Reward Indicator for MetaTrader 5 solves exactly this problem.
The indicator plots entry levels, Stop Loss and Take Profit on the chart and allows you to immediately see the relationship between potential risk and potential profit.
What is Risk/Reward Ratio and why is it important?
Risk/Reward Ratio, orR:R, shows how much potential profit a trader considers relative to the risk of a trade.
Conditionally:
1:1— risk equals potential profit;
1:2— potential profit is twice the risk;
1:3— potential profit is three times higher than the risk;
1:5— potential profit is five times higher than risk.
The formula is simple:
Risk/Reward = distance to Stop Loss / distance to Take Profit
For example:
Entry: 100
Stop Loss: 98
Take Profit: 106
The distance to Stop Loss is 2 points, and to Take Profit - 6 points.
We get:
2 : 6 = 1 : 3
That is, the potential profit in this scenario is three times the size of the risk under consideration.
It is important to understand:R:R is not a prediction that a transaction will be profitable.
A ratio of 1:5 does not mean that the market will necessarily reach Take Profit.
This is just a way to see the structure of the deal in advance and evaluate how much the potential profit corresponds to the risk taken.
What does KT Risk Reward Indicator do?
After installationKT Risk Reward Indicator MT5Three main levels appear on the chart:
Entry
The level of expected entry into the trade.
Stop Loss
The level at which the transaction scenario is considered canceled and the potential loss is limited.
Take Profit
The target level at which potential profit is fixed.
The main advantage is that these levels can be visually compared directly to the chart.
Instead of separately counting the distances between prices on a calculator, the trader gets the structure of the deal right before his eyes.
The original description of the indicator also indicates that Entry can be synchronized with the current price, which is convenient when preparing a trade directly on the chart.
What does the indicator look like on a chart?
Our examples clearly show the basic mechanics.
In one scenario the indicator shows:
Entry → Stop Loss → Take Profit
and calculates the ratio approximately1:7.25.
This means that the distance to the potential target is significantly greater than the distance to the Stop Loss.
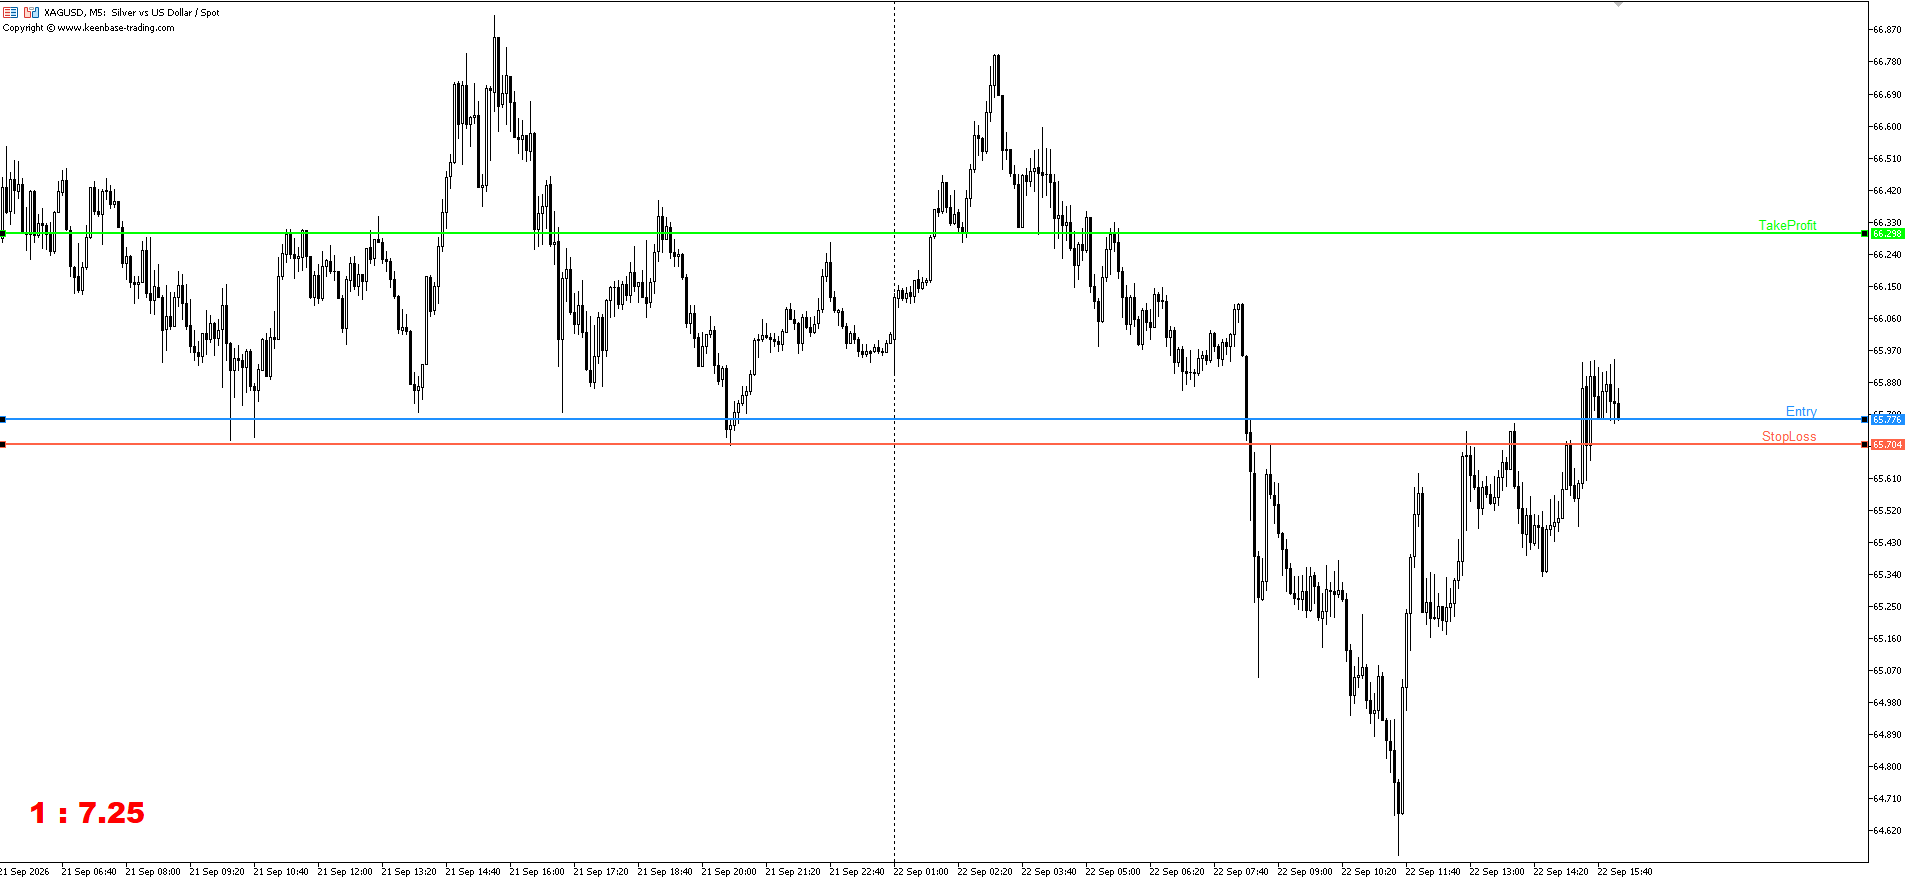
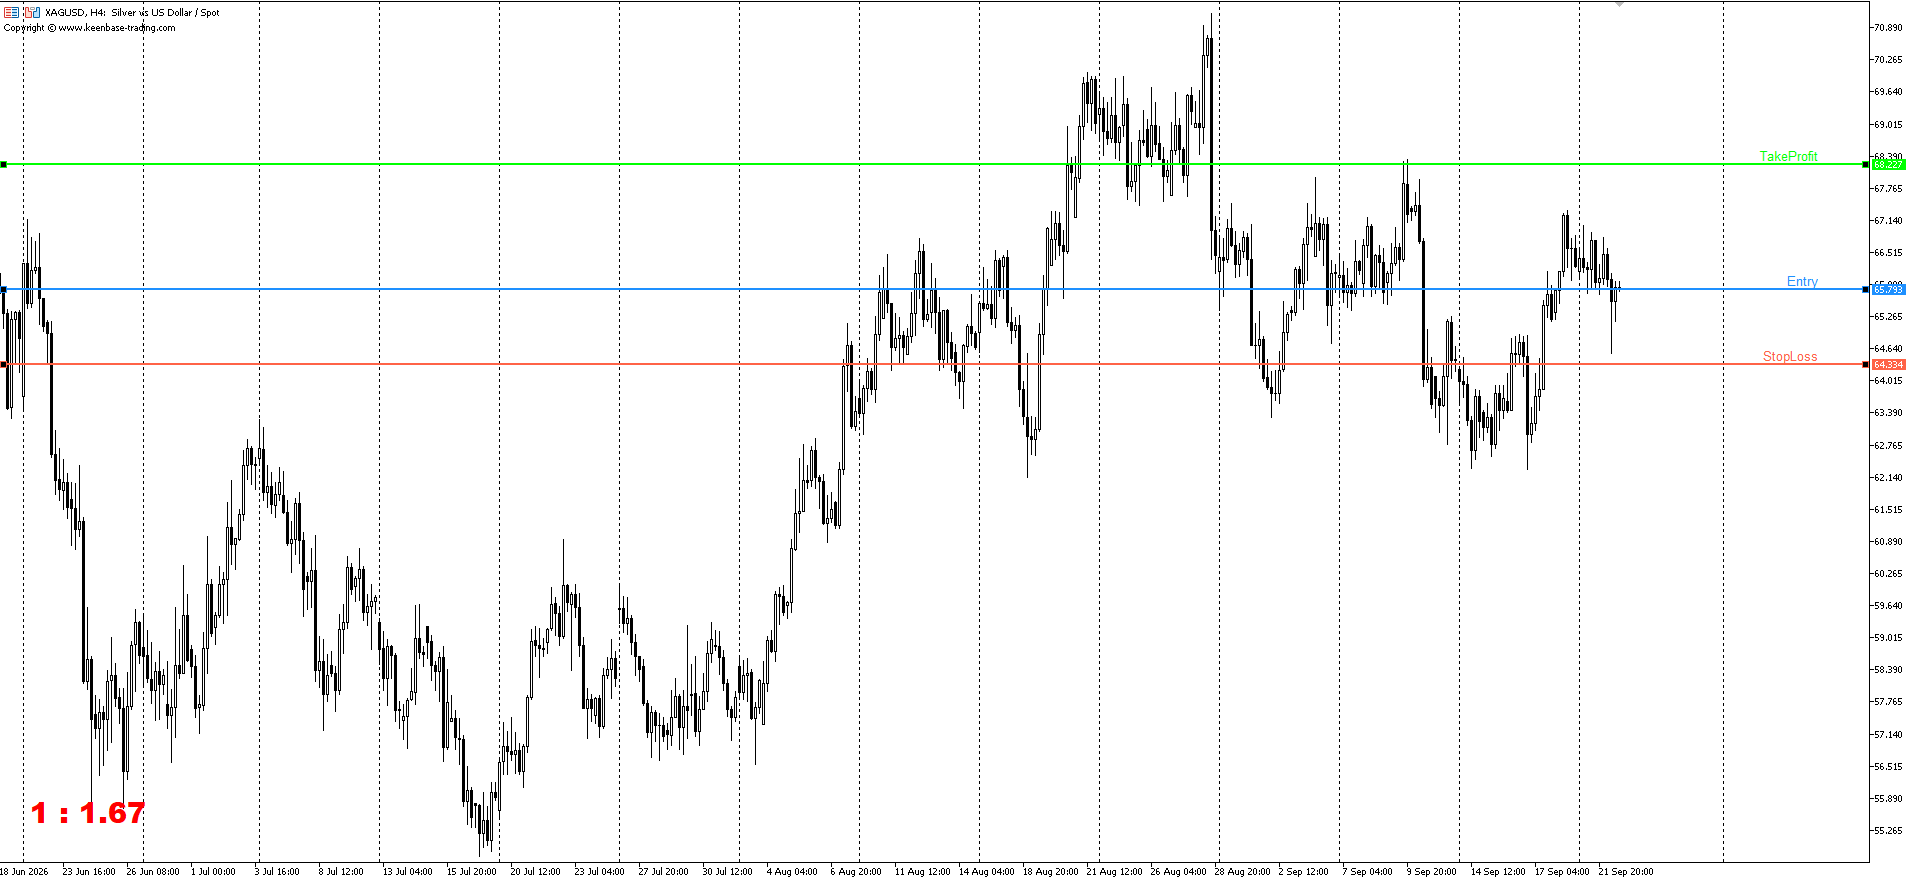
Another example shows a ratio of about1:1.67.
And this is a completely different deal structure: the potential profit exceeds the risk, but significantly less than in the first scenario.
This is why a visual Risk/Reward can be more useful than a single number.
The trader immediately sees not only the R:R value itself, but alsowhere are the levels relative to the current market structure.
KT Risk Reward Indicator: main features
The indicator is designed primarily for preliminary assessment of a transaction.
Among the main features:
display Entry;
display Stop Loss;
display Take Profit;
automatic calculation of Risk/Reward Ratio;
Entry synchronization with the current price;
visual work with levels directly on the chart;
color settings;
changing line thickness;
changing the size of signatures;
selecting the position of the information block.
The indicator description also indicates the ability to customize the font, colors and position of the Risk/Reward Ratio display.
KT Risk Reward Indicator MT5 Settings
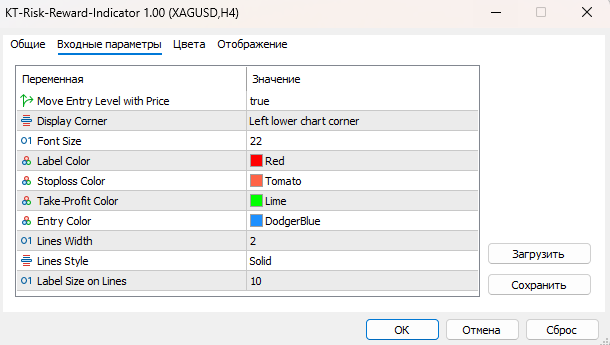
In the indicator settings window, you can change several parameters.
Move Entry Level with Price
This parameter determines whether the Entry level should move with the current price.
When the setting is enabled, Entry is synchronized with the price.
If you set the valuefalse, the Entry level can be used more flexibly and moved separately.
This is especially useful when a trader wants to determine an expected entry price in advance rather than using the current market price.
Display Corner
Determines the position of the information block on the chart.
This is a small adjustment, but it is useful if the selected angle is already occupied by another indicator or trading information.
Font Size
Responsible for the size of the displayed text.
You can choose the size to suit your monitor resolution and chart scale.
Label Color
Color of text symbols.
Stoploss Color
Stop Loss line color.
In the standard version, Stop Loss is indicated on your screenshotsred.
Take-Profit Color
Take Profit line color.
In the standard version it is usedgreen.
Entry Color
Entry level color.
In your examples it is displayedblue.
This results in a simple visual diagram:
green → Take Profit
blue → Entry
red → Stop Loss
This approach allows you to determine the structure of the transaction almost instantly.
Lines Width
Allows you to change the line thickness.
This is especially useful on large monitors or when working with instruments where the graph contains many levels.
Lines Style
Defines the style of the lines—for example, a solid line.
Label Size on Lines
The size of the signatures directly on the levels.
For example:
Entry
Stop Loss
Take Profit
This allows you not to get confused in the levels even when there are additional lines of technical analysis on the chart.
How to use KT Risk Reward Indicator in real trading
The simplest option is to consider the indicator asfinal filter before opening a position.
Let's say a trader sees a potential entry point.
Instead of immediately opening a trade, you can go through several steps.
Step 1. Define Entry
First, the price at which the trader considers entry is determined.
It could be:
level breakdown;
retest;
rebound from support;
rebound from resistance;
out of range;
continuation of the trend.
Step 2. Determine Stop Loss
Next question:
Where does the trading scenario cease to be relevant?
It is better to determine Stop Loss not simply by the desired size of loss, but taking into account the market structure.
For example, if a trader buys after breaking resistance, the Stop Loss may be below the zone that was supposed to hold the price.
Step 3. Determine Take Profit
After this, a potential target is identified.
Here you can use:
previous high or low;
support/resistance level;
liquidity;
technical structure;
range;
Fibonacci;
ATR;
other elements of the trading system.
Step 4. Check Risk/Reward
Now the indicator allows you to quickly see the relationship between levels.
And here one of the most important points arises.
Not every technically beautiful entry point is a good trade.
Sometimes the signal looks convincing, but the nearest reasonable target is too close.
In this case, the potential profit may not correspond to the risk taken.
It is precisely this situation that Risk/Reward helps to noticebefore opening a position.
Why high Risk/Reward does not mean a high probability of a transaction
It's easy to fall into a trap here.
You can see the ratio:
1:7
and decide that this is automatically better than:
1:2.
But it's not that simple.
The further Take Profit is, the more difficult it is for the price to achieve this goal.
Therefore, R:R cannot be considered separately from the likelihood of a trading scenario occurring.
For example:
Strategy A
R:R = 1:1.5
High frequency of scenario implementation.
Strategy B
R:R = 1:5
The goal is much further away and is achieved less often.
This is not to say that one of them is automatically better.
Importantthe entire trading system: accuracy of entries, frequency of trades, position size, probability of achieving the goal, maximum loss streak and money management rules.
What should the Risk/Reward Ratio be?
There is no universal value for all trading strategies.
One trader's working model may be 1:1.5.
Another builds a system around 1:2.
The third looks for rare moves with a potential R:R of 1:4 or 1:5.
So use a rule like“never trade below 1:3”without taking into account a specific strategy would be too simplistic.
It is much more important to understand the mathematics of the system.
For example, a strategy with an R:R of 1:2 can remain mathematically interesting even with a relatively small proportion of profitable trades - if losses are truly limited and profitable positions achieve their planned goals.
And vice versa: even a high R:R will not save the strategy if the entries are random, Stop Loss is constantly expanding, and Take Profit is not regularly achieved.
KT Risk Reward Indicator and money management
One of the most useful aspects of the tool is that it forces you to separate two different questions:
where to enter?
and
Is it even worth opening a trade with such a ratio of risk and potential profit?
These are two different tasks.
For example, a trader might determine:
Entry = $65.77
Stop Loss = $65.70
Take Profit = $66.29
The indicator allows you to see this structure on the chart and evaluate R:R.
After this, you can separately calculate the position size based on the acceptable monetary risk.
This is an important difference:
Risk/Reward determines the trade structure, and position size determines the amount of financial risk.
The indicator itself does not calculate a safe position size and does not guarantee profit.
It solves a more specific problem - it helps to visualize the relationship between Entry, Stop Loss and Take Profit.
Where the KT Risk Reward Indicator is especially useful
Forex
For currency pairs, it is important to understand in advance the distance between the entry, protective stop and target zone.
Gold
Gold can move quite quickly, so visually assessing the distance to Stop Loss and Take Profit is especially convenient.
Silver
On silver, the indicator can also be used to evaluate trade structure before entering.
Indexes
When trading indices, identifying risk in advance helps you avoid entering a position just because a technical signal looks attractive.
Cryptocurrencies
The high volatility of BTC and ETH makes a preliminary assessment of potential risk especially important.
Scalping, Day Trading and Swing Trading
KT Risk Reward Indicator is not tied to one trading style.
Scalping
When scalping, the distances between Entry, Stop Loss and Take Profit can be small, so visual control of the levels helps to quickly assess the structure of the transaction.
Day Trading
For intraday trading, the indicator can be used as the final stage of position preparation.
Swing Trading
On higher timeframes, the distances are much greater, but the logic itself remains the same:
Entry → Risk → Reward.
How to Install KT Risk Reward Indicator in MT5
If the indicator is supplied in the format.ex5, installation is performed in the standard way through the MetaTrader data directory.
Download the indicator file.
Open MetaTrader 5.
Go toFile → Open Data Folder.
Open the folderMQL5 → Indicators.
Place the indicator file in this folder.
Restart MetaTrader 5.
Open the windowNavigator.
Find KT Risk Reward Indicator.
Drag it to the desired chart.
After this, the Entry, Stop Loss and Take Profit levels should appear on the chart.
KT Risk Reward Indicator MT5 is not a trading signal
This is a fundamental point.
The KT Risk Reward Indicator does not tell you when to buy or sell.
It is not a price forecasting system.
The indicator does not independently determine:
market direction;
turning point;
trend strength;
probability of movement;
future price.
His task is much simpler -help structure an existing trading idea.
The trader himself determines the trading scenario, and the indicator helps to see its mathematical side.
That is why such a tool fits well into almost any technical analysis system.
Why Risk/Reward should be checked before a transaction
One of the common mistakes of novice traders is to first look for an entry point, and only then think about Stop Loss and Take Profit.
It turns out something like this:
“Oh, there's a good signal here. I’m buying.”
And after opening a position, the search for an answer to the question begins:
“Where should I put my stop now?”
A more disciplined approach looks different:
Entry → Stop Loss → Take Profit → Risk/Reward → position size → trade decision.
This changes the decision-making process itself.
The trader knows in advance where the scenario is canceled, where the target is and how much the potential profit corresponds to the risk taken.
KT Risk Reward Indicator: who is it suitable for?
The indicator can be especially useful for traders who:
use MetaTrader 5;
work with technical analysis;
Stop Loss is determined in advance;
use fixed Risk/Reward;
engage in scalping;
trade intraday;
use swing trading;
want to visually assess the structure of the transaction;
testing new trading strategies.
At the same time, the tool can also be useful for beginners, because it helps to visually understand one of the basic concepts of risk management.
Download KT-Risk-Reward Indicator for MT5 for free
Want to check the indicator on your charts?Download KT-Risk-Reward Indicator for MetaTrader 5 for freeand test it on historical data or a demo account.
The indicator helps to visually determineEntry, Stop Loss and Take Profit, and also immediately see the ratio of potential risk and profit.
→ Download KT-Risk-Reward Indicator for free
Where can you test a trading idea?
If you want to not only study Risk/Reward on a chart, but test your own trading system on the real market,athen trade with Avora Markets.
For starters, you can usedemo accountto test an idea without having to immediately risk your own capital.
If the trading model has already been tested and you are ready to move on to real trading, you canopen an account with Avora Marketsand use the KT Risk Reward Indicator as one of the elements of deal preparation.
Conditions with50% bonus on your first deposit and 10% on subsequent deposits— You should check the current conditions before depositing funds.
Bottom line
KT Risk Reward Indicator MT5 is a small but practical tool that solves one specific problem:
helps to see the ratio of potential risk and profit directly on the trading chart.
Instead of manual calculation, the trader receives three visual levels:
Entry → Stop Loss → Take Profit
and the corresponding Risk/Reward indicator.
The main advantage of the tool is not that it is able to predict market movements.
He does something else - he helpsstructure your trading idea in advance.
And this is fundamentally important.
Because a good deal doesn't start with a question:
“Where will the price go?”
And from the question:
“What risk am I taking and what do I get in return?”