
Half Trend Buy Sell Indicator for MT5: How BUY and SELL Signals Work
On the chart, price rarely moves in a straight line. The trend can be replaced by consolidation, short-term pullbacks and sharp reversals. Therefore, one of the main tasks of technical analysis is to determine not only the direction of movement, but also the moment when it begins to change.
Half Trend Buy Sell Indicator for MT5solves this problem visually: the indicator displays the direction of movement with the help of a line and marks potential changes in the trend with BUY and SELL arrows.
IndicatorSpot describes Half Trend as an arrow trend reversal indicator, which is designed primarily to determine the direction of movement and additional confirmation of technical analysis.Their page also indicates that the indicator does not redraw already generated signals.
But there is an important nuance here:the arrow itself is not a trading system. It shows the change in the status of the indicator, and the entry decision requires additional analysis of the price, market context and risk.
Briefly about the main things
Tool: Half Trend Buy Sell Indicator
Platform: MetaTrader 5
Type: trend-following / reversal indicator
Main signals:BUY & SELL
Example in the graph: XAUUSD, H4
Main objective:visually determine the direction of the trend and its potential change
What is Half Trend Buy Sell Indicator?
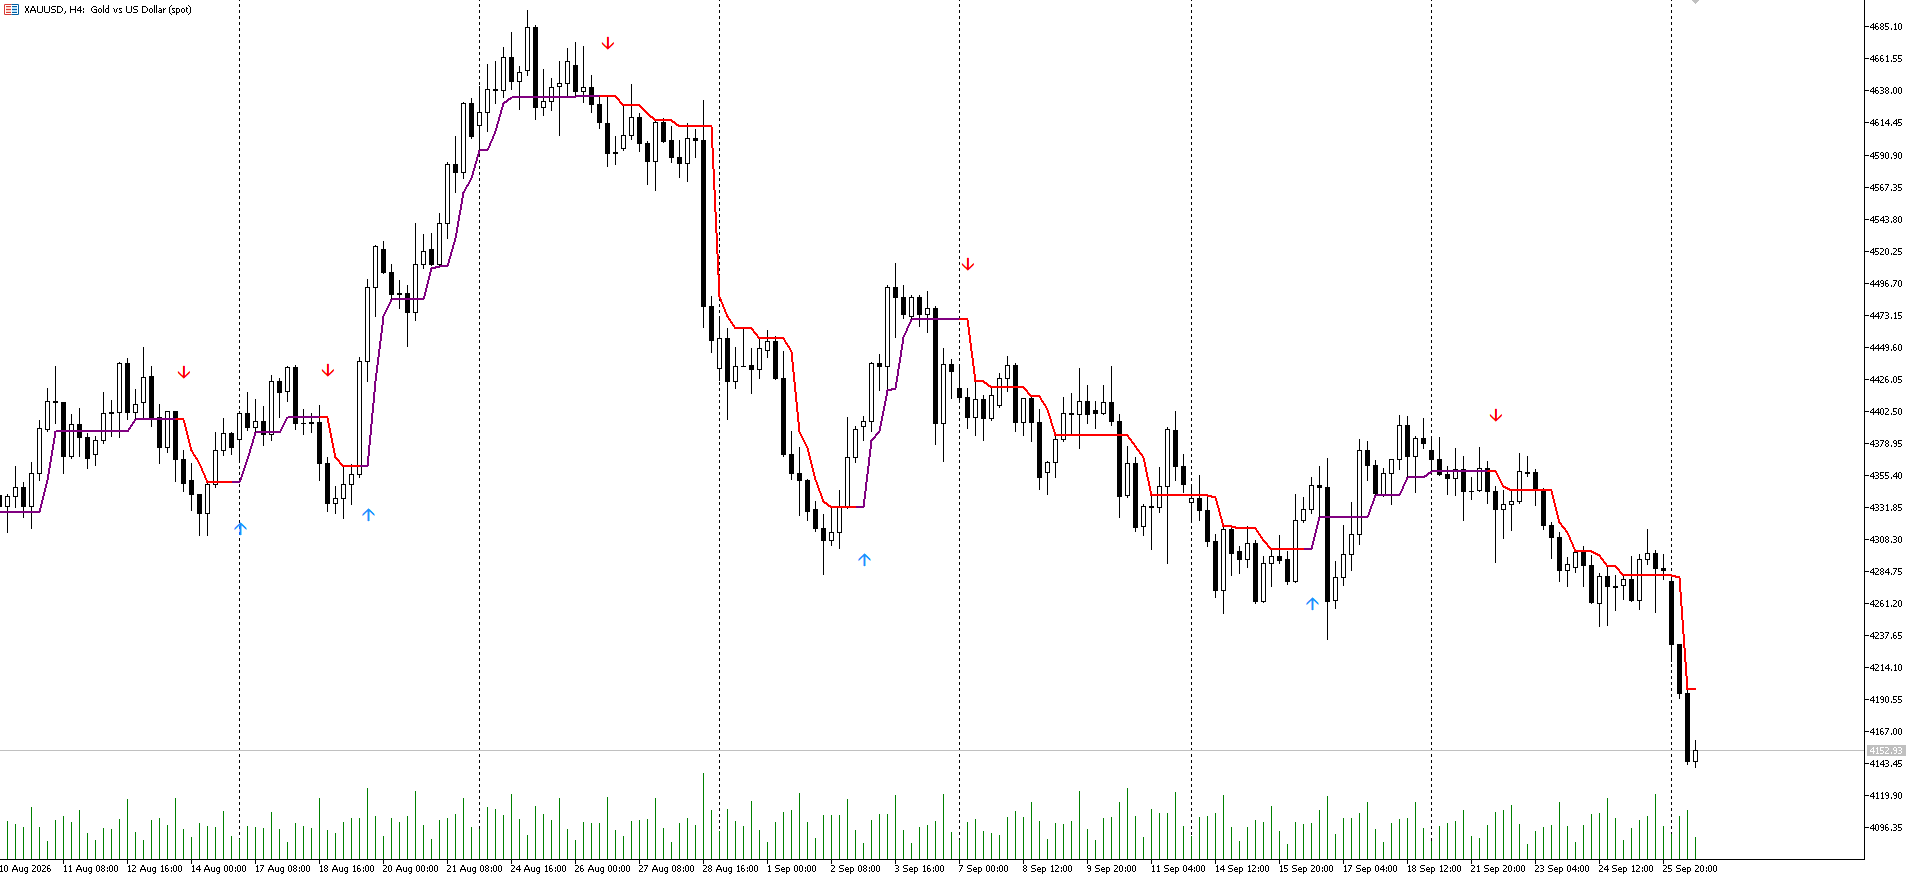
Half Trend is a technical indicator that is placed directly on the price chart.
Instead of a separate window with an oscillator, the trader receives a visual structure:
the line following the price movement;
changing its position when changing direction;
bUY and SELL arrows;
additional notifications if they are enabled in the settings.
The presented chart of XAUUSD H4 clearly shows how the line changes position after the price. When changing direction, arrows appear.
That is why the indicator is easier to perceive not as an independent entry system, but asvisual driving direction filter.
How do I read BUY and SELL signals?
BUY
The BUY-signal appears at the moment when the indicator algorithm detects a change in direction in the direction of growth.
In the graph, this is followed by the corresponding arrow.
But it is important to separate the two concepts:
BUY-signal ≠ guaranteed price increase.
After any reversal, the market can continue to move, move into flat, or form a false movement.
SELL
The SELL-signal operates in a mirror-like manner.
When the indicator detects a downward change in direction, a red arrow appears on the graph.
In the XAUUSD H4 example presented, several SELLs appear before subsequent downsizing phases. At the same time, there are also areas of consolidation and multidirectional movement between the signals.
This shows well the main limitation of any trend-following tool:the signal becomes the most understandable in a pronounced movement, but it is much more difficult to read in the flat.
What does the Half Trend line show?
In addition to the arrows, the indicator displays a line directly near the price.
In the graph presented, it changes color and position:
a purple line accompanies one phase of movement;
red line — the opposite;
a sharp change in the position of the line is accompanied by reversal signals.
This approach allows you to see not only a single arrow, but also the wider picture.
For example, if the price continues to hold above the line after BUY, the trader receives an additional visual reference point relative to the current direction.
IndicatorSpot also describes Half Trend as a tool that maintains a stable trend direction and can be used to further validate technical analysis.
Half Trend Buy Sell Indicator Settings for MT5
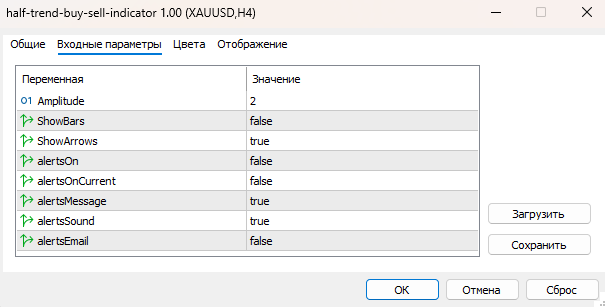
The following set of parameters is used on the presented parameter screen:
Amplitude = 2
Amplitude— one of the main parameters of the indicator.
In this case, the value is set2.
The parameter is related to the sensitivity of the Half Trend calculation. In the published materials on Half Trend, a higher Amplitude value is usually used to obtain less frequent and smoother changes, while a smaller value makes the indicator more sensitive to price movements.
Therefore, changing the Amplitude can significantly change the number of signals.
ShowArrows = true
The arrows are on.
It is they who visually mark potential points of change of direction.
If you disable this option, the indicator line will remain the main visual element and the arrows will be hidden.
ShowBars = false
In the presented set of settings, the additional display of bars is disabled.
This leaves the chart cleaner and puts a major emphasis on price, the Half Trend line, and the arrows.
Notifications: What features are available?
The settings contain the following parameters:
alertsOn;
alertsOnCurrent;
alertsMessage;
alertsSound;
alertsEmail.
In the presented version, the main notifications are not activated throughalertsOn, wherein the message and acoustic signal parameters are enabled.
This allows you to adapt the indicator to different operating scenarios: from fully visual analysis of the schedule to receiving notifications about the appearance of the signal.
However, before using notifications, it is important to separately check their behavior on the version of the indicator that is installed in your MT5.
On which timeframes should I use Half Trend?
IndicatorSpot indicates that Half Trend can be applied on timeframesm15 to H4and also notes its use for intraday analysis.
At the same time, the timeframe significantly affects the nature of the signals.
On a shorter chart:
more market noise;
more short-term fluctuations;
signals may occur more frequently.
On a higher timeframe:
fewer signals;
each change of direction reflects a larger section of movement;
but potentially more distance between the signal and the actual price reversal.
Therefore, the choice of the timeframe itself does not make the signal "better" or "worse" — it changes the analysis horizon.
The main risk is to use the arrow without context
The most common mistake when working with such indicators is to perceive each arrow as a ready-made command to open a position.
This is especially problematic during lateral movement.
Let's imagine the situation:
Price → Flat → BUY → slight upward movement → SELL → reversal → return to BUY.
For a trend-following indicator, such a sequence is natural: the market has not formed a stable trend.
Therefore, it is more logical to consider Half Trend together with:
market structure;
support and resistance levels;
the higher timeframe;
volatility;
fundamental context;
risk management rules.
What is especially important to check before use
There is another practical point.
Some versions of Half Trend may show a signal on the emerging candle, after which the position of the signal may change before the bar closes. In the discussions, traders separately drew attention to this feature of the work of such HalfTrend implementations.
Therefore, when testing, it is important to separate:
signal inside the current candle
and
signal after closing the candle.
These are fundamentally different situations.
For historical analysis, it is also necessary to take into account exactly the version of the indicator and those settings that are used in the real trading environment.
What to track?
1. Direction Half Trend
Look not only at the last arrow, but also at the state of the line.
2. Price structure
BUY after forming a sequence of higher highs and lows has a different context than BUY inside a wide flat.
3. Senior timeframe
The H1 signal may look different if the market is in the opposite phase on H4.
4. Volatility
During sudden movements, the number of false short-term changes of direction may increase.
5. Closing the candle
If a particular version of the indicator is capable of changing the signal on an unclosed bar, the final assessment should be carried out after the candle is formed.
6. Market Events
Macroeconomic publications and unexpected news can dramatically change the price movement regardless of the technical indicator readings.
Main conclusion
The Half Trend Buy Sell Indicator for MT5 is a visual directional and potential trend reversal tool.
Its strong point is the simplicity of interpretation: the trader sees the line, the direction of movement and the BUY/SELL arrows directly on the price chart.
But simplicity doesn't mean autonomy.
The arrow shows the state of the algorithm, not the guaranteed result of the future movement. Therefore, it is most meaningful to use Half Trend as part of a broader analysis system, where the signal is considered together with the market structure, timeframe, volatility and risk management.
For XAUUSD and other volatile instruments, this is especially important: the same signal can have a completely different context in the trending market and during consolidation.
Follow the technical tools and the development of global markets together with AVORA MARKETS.