
Breakout Indicator for MT5: How to Find Level Breakouts and Trade Out of Range
The market doesn't move in a straight line most of the time.
The price can be in a relatively narrow range for hours or even days: buyers try to raise the market higher, sellers return it every time. A familiar picture appears on the chart —consolidation, compression of volatility and struggle over the limits of the range.
And then something happens for which traders are generally looking for such situations:
price is out of range.
Sometimes the movement after the breakout is so fast that the opportunity for a comfortable entrance disappears in just a few candles.
It is on such situations that the logic is builtBreakout Indicator for MetaTrader 5— a tool that automatically selects the working area of the range and helps to visually track the moment when the price goes beyond its limits.
In this article, we will analyze:
what is breakout trading;
how Breakout Indicator MT5 works;
why the indicator needs a consolidation zone;
how to search for an entrance after a breakdown;
why the retest is often more interesting than the breakout itself;
what settings are available
how to use the indicator on EUR/USD, gold, oil and other instruments;
what mistakes are most often made by traders;
wherefree Download Breakout Indicator for MT5.
What is breakout trading?
Let's start with the most important thing.
Breakout, or breakout, is a situation where the price goes beyond a range, support level, resistance, or other significant area within which the market has been for some time.
Imagine a spring.
The price moves for several hours between two borders:
resistance → range → support
Every attempt of buyers to go higher meets sellers.
Every attempt by sellers to push the price lower meets buyers.
But the longer such a struggle continues, the more interesting the moment becomes when one of the parties finally gets the advantage.
Price goes out of range — and the movement begins.
It is this transition:
consolidation → breakdown → pulse
and is the central idea of breakout trading.
Why are breakouts so interesting for traders?
A breakdown differs from a normal movement in one important way.
Before the breakout, the market is in a state of uncertainty.
After the breakout, the direction appears.
For example, EUR/USD trades for several hours between 1.1450 and 1.1480.
Buyers cannot gain a foothold above 1.1480.
Sellers cannot push 1.1450.
If the candlestick then closes above the upper end of the range, the market gets a new benchmark.
But there's a problem here.
How can I see this range in advance?
This is where automation becomes useful.
What does Breakout Indicator do for MT5?
Breakout Indicator is designed to automate the search for such situations.
Instead of independently plotting the boundaries of each range, the trader receives a visually highlighted area within which consolidation was formed.
After the price is outside the range, it becomes easier to assess the potential breakout setup. The description of the tool also indicates the ability to use it to search for potential BUY and SELL-scenarios.
In fact, the trader only needs to answer a few questions:
Where did the range form?
Where is its upper boundary?
Where is the bottom one?
Is the price still within range or out of range?
And most importantly:
was it a real breakout or a normal false exit?
What the indicator logic looks like
The mechanics are quite simple.
1. A range is formed
The price stays between the upper and lower limits for a while.
2. The indicator highlights the area
A zone appears on the graph that helps to visually define the boundaries of the range.
3. The price approaches the border
The market is starting to test resistance or support.
4. There is a breakout
The candle is out of range.
5. The trader evaluates the continuation of the movement
Here you can already use price action, volume, senior timeframe and other confirmation tools.
This is the sequence described in the materials on the Breakout Indicator: the range of the support/resistance → zone, the price → output is → a potential entry point.
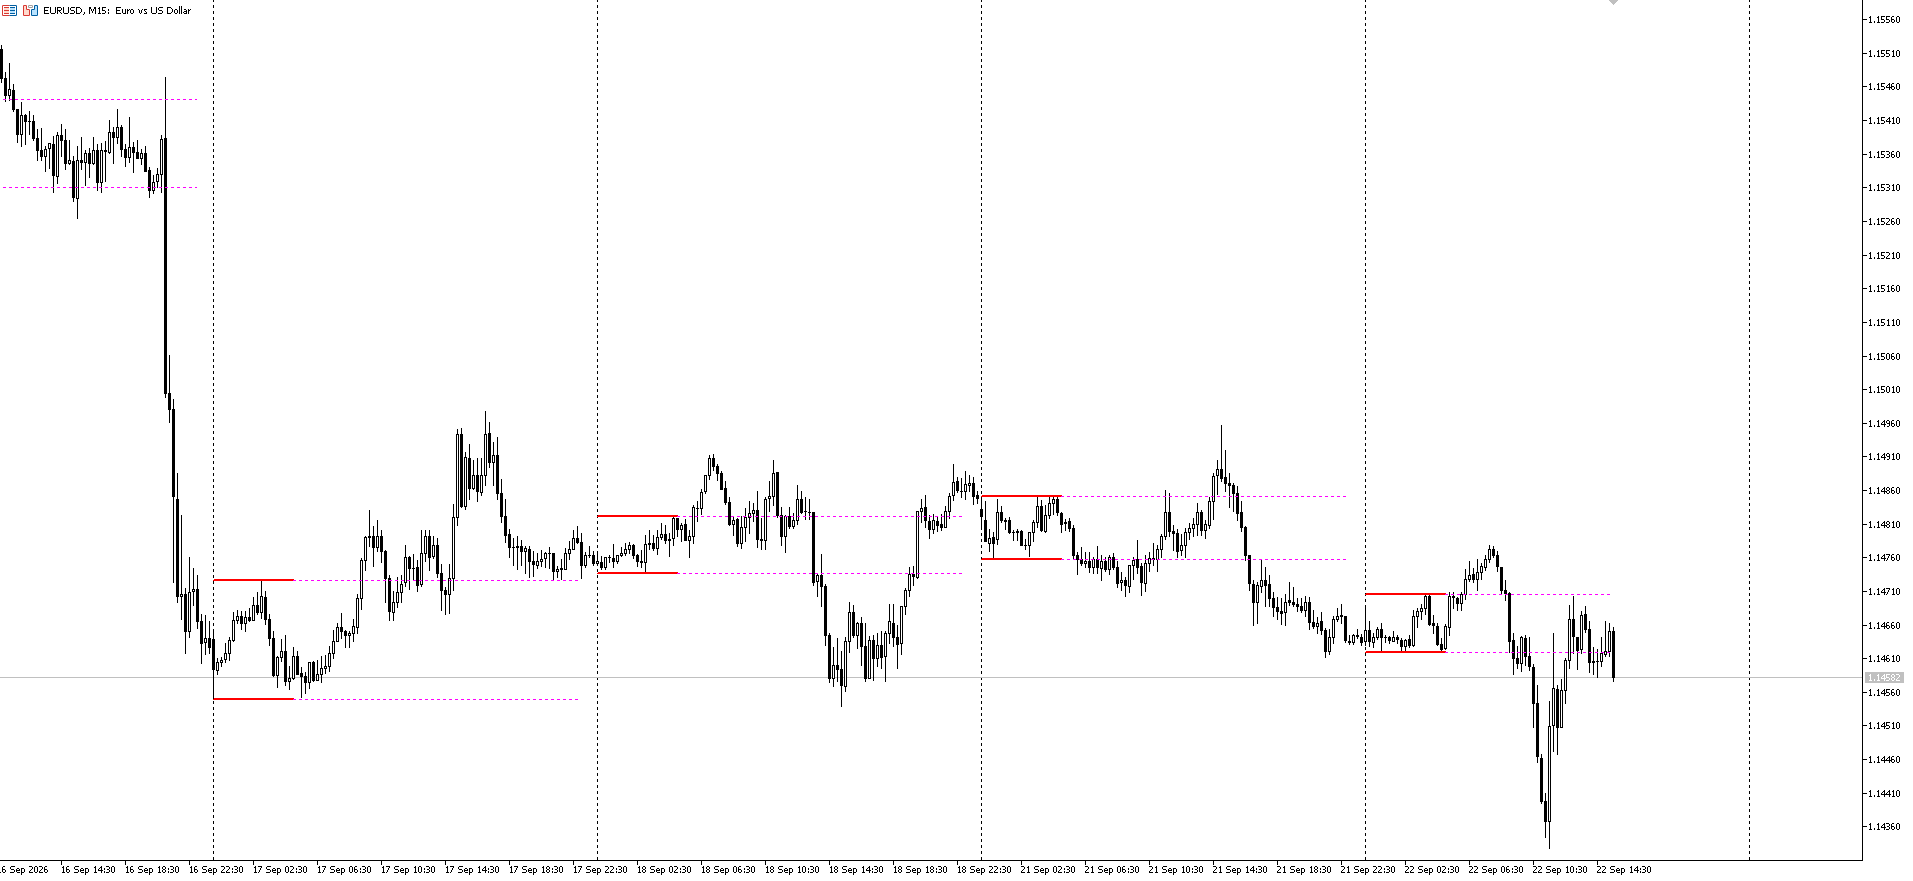
Breakout Indicator MT5 highlights the range of consolidation and helps to track the release of the price beyond its borders.
Breakout is not yet a reason to click Buy or Sell
This is where the fun starts.
Beginners often perceive breakout as straightforward as possible:
The price is higher than the → BUY resistance.
But the market doesn't work that way.
The price can go above the range by just a few points, attract buyers — and then sharply return back.
It's calledfalse breakout, or a false breakout.
Therefore, the very fact that the price goes beyond the range is not a guarantee of the continuation of the movement.
Even the Breakout Indicator source materials separately emphasize the risk of false breakouts and the need to consider risk management and the market context.
That's why there are at least two interesting ways to work with a breakout.
Strategy #1: Enter after the breakout plug is closed
This is the most straightforward option.
Let's say the market is in an upward context.
The price consolidates for several hours under resistance.
Then a candle is formed, which closes above the upper limit of the range.
The trader considers entering BUY after confirming the breakout.
Diagram:
Consolidation → breakdown plug → closure → inlet
The advantage of this approach is that the trader does not try to guess the breakout in advance.
Disadvantage — part of the movement could have already occurred before the moment of entry.
Therefore, sometimes the ratio of potential risk and profit becomes less attractive.
Strategy #2: breakout + retest
But this option is much more interesting.
Instead of buying immediately after the breakout, the trader waits for the price to return to the broken border.
For example:
The price was under resistance.
There was an upward breakout.
Price continued to move.
Then she returned to the former resistance.
The level held.
Price started moving up again.
At this point, the former resistance potentially turns into support.
The classical structure is obtained:
Resistance → Breakout → Retest → Support → Continuation
This allows you not to chase the price after the impulse, but to wait for a more controlled entry point.
A similar scenario is also considered in the Breakout Indicator materials as a separate way to work with a breakout.
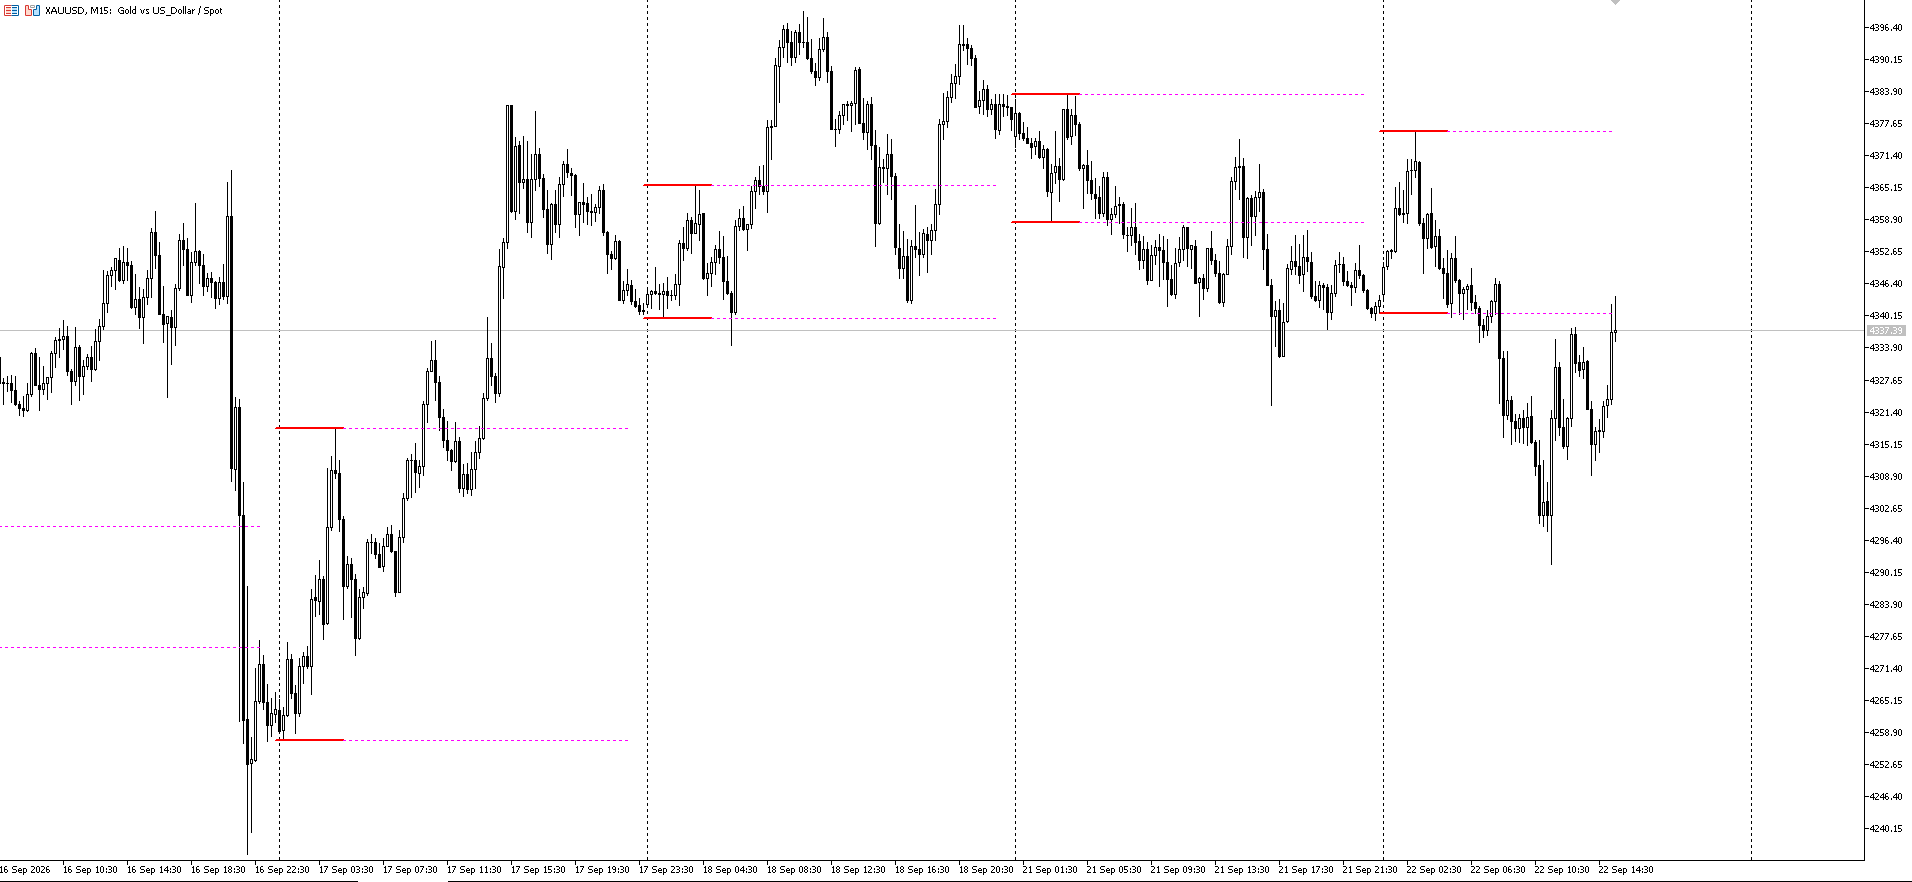
Classic breakout + retest structure: after exiting the range, the price returns to the broken border.
Why a retest can be more important than the breakout itself
There is an interesting psychological point.
At the time of the breakout, the market is as emotional as possible.
Some traders see the beginning of a new trend.
Others take profits.
Still others try to enter as quickly as possible.
Because of this, the first candles after a breakout can be very volatile.
Retesting makes a bit of a difference.
The market returns to the level and shows:
are members ready to defend this price again?
If the former resistance turns into support and the price gets an upward momentum again, the structure becomes more interesting.
But it is important to remember:
retest does not guarantee the continuation of the movement.
If the price goes back inside the old range and anchors there, the initial breakout may turn out to be false.
Breakout Indicator MT5 Settings
One of the strengths of the indicator is the ability to adjust the time range that is used to form the zone.
In the original description, the following parameters are indicated:
Period Hour begin— hour of the beginning of the billing period;
Period Minutes begin— the minute of the beginning of the period;
Period Hour End— hour of the end of the period;
Period Minutes End— minute of the end of the period;
Area Hour End— hour of the end of the display of the area;
Area Minutes End— the minute of the end of the display of the area.
This is an important detail.
The indicator does not force to use the same temporary structure in all markets.
The trader can adapt the range to the specific trading logic.
For example, you can explore a specific section of a trading session and then observe what happens after it ends.
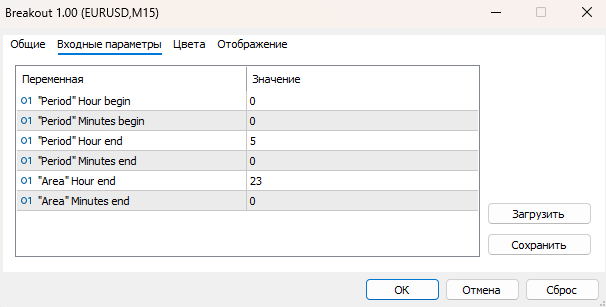
Breakout Indicator settings for forming the range and period of zone display.
How to use Breakout Indicator in different markets
Interestingly, the very concept of a breakout is not tied exclusively to Forex.
The same logic can be used in the analysis of:
EUR/USD
Currency pairs often form intraday ranges, after which the activity of large trading sessions can lead to an expansion of the movement.
Gold
XAU/USD is especially interesting to observe during a sharp increase in volatility.
A narrow range breakout can be accompanied by a strong impulse, but at the same time the risk of a false exit increases.
Oil
For oil, breakout patterns can become particularly prominent during news movements, changes in inventory expectations, or geopolitical events.
Indices
US30, NASDAQ, and other indices also often spend significant time in the range before volatility expands.
Therefore, it is logical to consider the Breakout Indicator not as an “indicator for one currency pair”, but asvisual tool to search for market ranges and their output.
Which timeframe to use?
There is no one-size-fits-all answer
And this is exactly the case when you should not promise the trader an "ideal timeframe".
On small timeframes, there will be more signals, but at the same time, the amount of market noise increases.
There may be fewer ranges on H1 or H4, but they potentially have more significance in the context of the movement of the higher timeframe.
Therefore, a reasonable approach:
junior timeframe — to search for an entry point;
senior timeframe — to understand the context.
For example, a trader can analyze the direction of the market on H4, and look for the breakout on M15 or M30.
Breakout Indicator + Price Action
This is where the indicator reveals itself best.
It is not necessary to turn it into a stand-alone trading system.
On the contrary, it can be used as the first filter.
For example:
Step 1
Breakout Indicator shows the range.
Step 2
The trader looks at the direction of the higher trend.
Step 3
Estimates the strength of the breakout candle.
Step 4
Checks the volume if the volume data is available and relevant to the tool.
Step 5
Waiting for retest or confirmation of continuation.
Step 6
Only then does he consider the deal.
Thus, the indicator does not turn into a "Buy/Sell button", but into a part of the trading process.
The most common mistake when trading breakouts
Buy after the market has run away.
It happens all the time.
The price breaks through the level.
The next candle gets big.
The trader is afraid to miss the movement.
The input occurs almost at the maximum pulse.
After a few candles, the market makes a regular pullback — and the position is in a drawdown.
That is why it is useful to determine in advance:
where the range is located;
where its boundary is;
where the breakdown will be considered confirmed;
where the scenario cancellation level is located;
where the potential profit-taking area is located.
And only after that to open a deal.
Another mistake is to consider each breakout as real
The market likes to catch traders at obvious levels.
The price goes beyond resistance.
Buyers enter.
Then the price goes back into the range.
The feet are triggered.
After that, the market really turns around.
Therefore, a good breakout setup is not easy:
“price crossed the line.”
You need to look atcontext of movement.
How to filter false breakouts
You can use a few simple filters.
1. Closing the candle
Do not react only to the shadow of the candle.
2. Senior timeframe
Check where the market is going overall.
3. Scope
If the tool and the data source allow a qualitative assessment of the volume, a sharp increase in activity may be an additional factor.
4. Retest
Wait for the price to return to the broken border.
5. Price Action
See how the market reacts to the level.
6. Risk Management
Even the perfect-looking structure can turn out to be wrong.
Free Download Breakout Indicator for MT5
If you are usingMetaTrader 5and want to test breakout trading yourself, Breakout Indicator can be used as a tool for visual search of ranges and breakouts.
DOWNLOAD BREAKOUT INDICATOR FOR MT5 FOR FREE
Before using it on a live account, it makes sense to first test the indicator on the history and demo account.
How to test the strategy without risk?
If you are just starting to learn breakout trading, there is no need to immediately move to a real account.
Can be openedavora Markets Demo Accountand test the idea in market conditions without the risk of using real funds.
This is especially useful for checking your own rules:
which timeframe to use;
whether to wait for the candle to close;
whether to use retest;
which stop-loss to apply;
which tools show the most understandable ranges;
at what time of day the most interesting breakout setups appear.
Open a demo account with Avora Markets
When the logic of the strategy has already been tested, the trader can independently decide whether this approach is suitable for further work.
Why Breakout Indicator is not the Grail
This is perhaps the most important part of the whole article.
The indicator does not know where the market will go next.
It cannot guarantee a profit.
It does not negate the need for analysis.
And it is not able to remove false breakouts from the market.
Its task is much simpler:
help the trader quickly see the structure that would otherwise have to be searched manually.
The original description of the tool also warns of false breakout and recommends using stop-loss, risk management and taking into account the market context.
And this is how it is more reasonable to perceive it.
Not as a guaranteed signal generator.
And howa tool for searching for market situations.
Breakout Indicator MT5: Highlights in 30 Seconds
If you remove everything superfluous, the concept looks like this:
1. Price forms a range.
↓
2. The indicator highlights the workspace.
↓
3. The price is approaching the border.
↓
4. A breakdown occurs.
↓
5. The trader checks the confirmation.
↓
6. If necessary, a retest is awaited.
↓
7. Only after that it considers the transaction.
A simple idea.
But simple market structures are often the most useful for system analysis.
Do you want to test the breakout strategy in practice?
A theory becomes much more useful when it can be tested on a real chart.
Openavora Markets Demo Account, install the Breakout Indicator for MT5 and test several strategy options: entry after closing the breakout candle, breakout + retest and filtering signals by the highest timeframe.
So you can not just look at beautiful examples on the chart, but independently check which rules are right for your trading style.
Open a demo account with Avora Markets
Trading in financial instruments involves risk. Past results do not guarantee future results.