
Bitcoin is going up again. But who exactly is buying?
Back on September 15, Bitcoin was trading around$75 000, and on September 21, the price has already risen above$85 000. At the intraday high, BTC reached about $85,200, updating the high since January.
The BTCUSD H1 chart shows how dramatically the market structure has changed. After several days of consolidation, the price first returned $80,000, then broke through the area of previous highs and almost vertically went above $84,000.
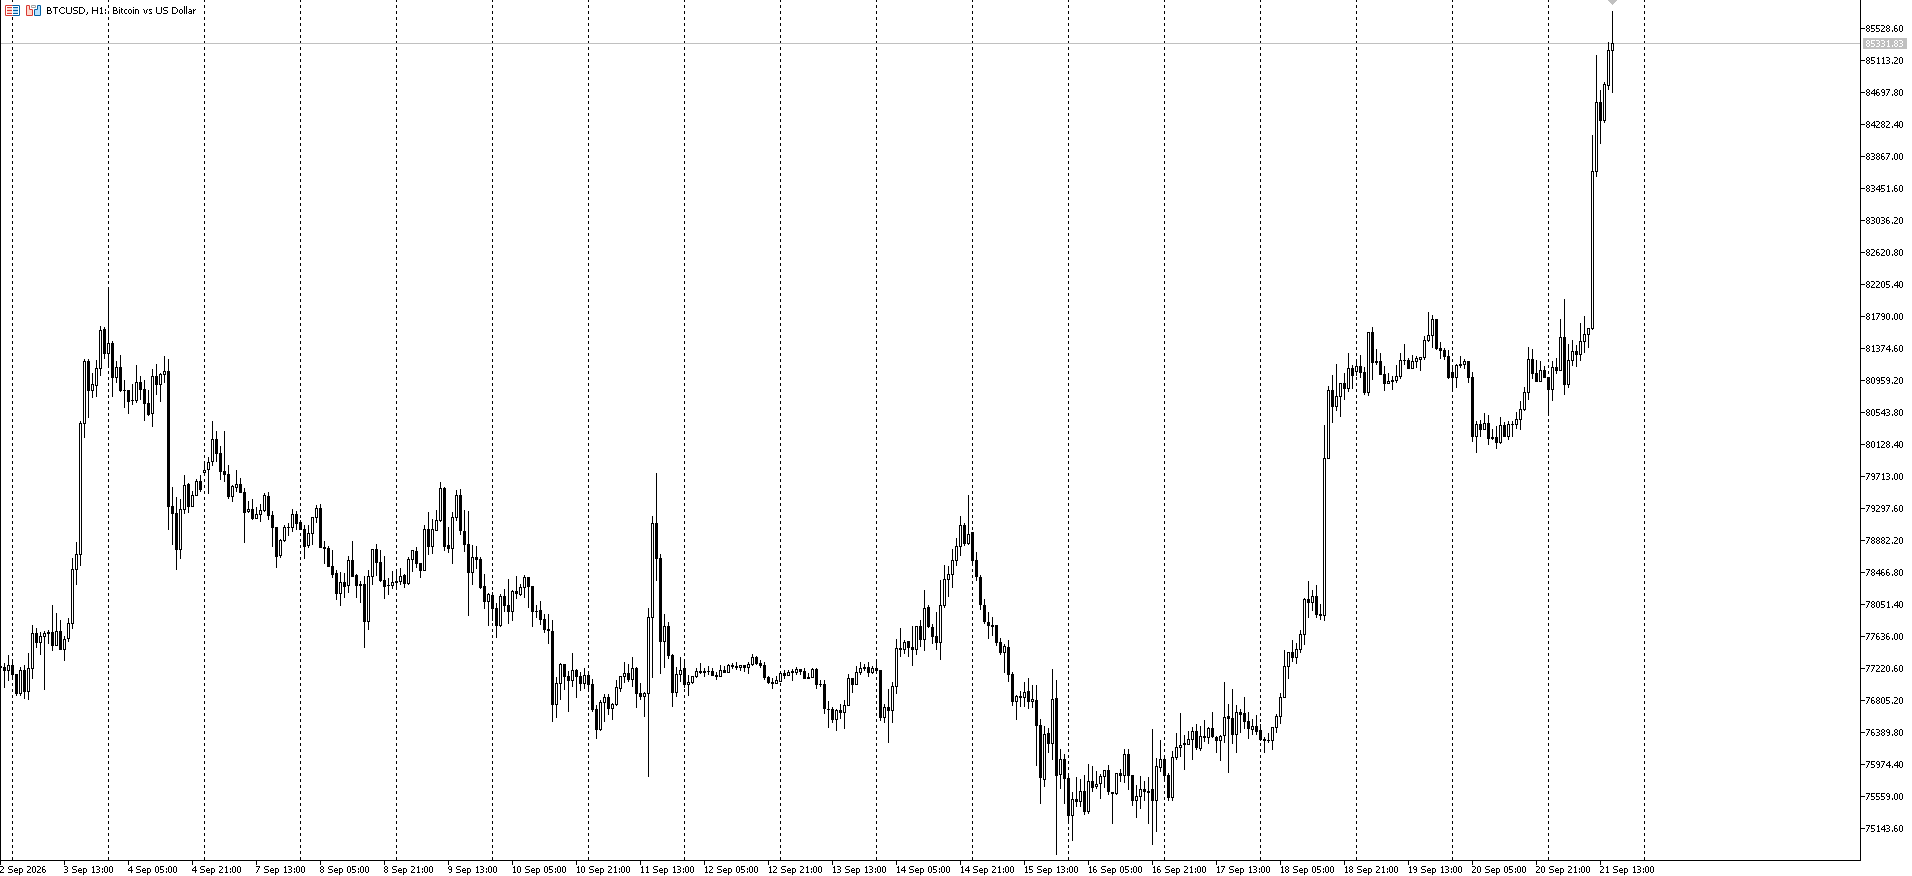
Bitcoin broke through the multi-week resistance area and accelerated the movement above $85,000.
It looks like a normal breakout, but there are several capital flows behind it.
And the most interesting thing starts here.
1. ETFs are really back for Bitcoin
One of the main factors of the movement is now associated with American spot Bitcoin ETFs.
After strong outflows in the middle of last week, the market changed direction abruptly.
On September 15, the US spot Bitcoin ETF went about$450 million, and on September 16, around$296 million.
But already on September 17, the flow turned around:
+$159.5 million
And on September 18, the influx was about:
+$433 million
And more$310 millionfidelity FBTC accounted for about this amount, and about $108 million for BlackRock IBIT.
That is, institutional demand has really returned.
But there's an important detail here.
This is not a story about the fact that billions of dollars suddenly came into Bitcoin in one day.
For the week of September 14–18, the cumulative result of the American spot Bitcoin ETF turned out to be only slightly positive, about+$6.2 millionas the huge Friday influx almost completely offset previous outflows.
Therefore, ETFs are more likely tofuel to restore demandbut not the only explanation for today's candle.
2. The real accelerator of the movement turned out to be in the derivatives market
This is where the fun starts.
When Bitcoin broke through $82,000, the market was literally crammed with short positions.
The rise in price began to forcibly close the shorts.
In the last 24 hours, about$746m Cryptocurrency Positions, of which approximately$648 million fell on the short position.
The mechanics are simple:
BTC rising → shorts receive loss → positions are forcibly closed the → system buys BTC → price rises even more the following shorts → are eliminated.
The result is a domino effect.
It is especially significant that in just one hour more than$159 millionpositions.
That's why the movement on the chart looks so vertical.
This is no longer just a purchase.
Thisforced purchase by those who stood against the movement.
3. Why did the short squeeze happen right now?
Because Bitcoin finally broke through a level that the market couldn't pass several times.
Area around$82 000–83 000acted as a serious resistance for a long time.
After its breakdown, the technical structure changed dramatically.
IG notes that BTC on September 21 passed above the previous May high around $82,293 and rose to around $85,300.
That is, the classic scenario occurred:
resistance → accumulation shorts → breakdown → foot → elimination → acceleration.
That is why part of today's growth cannot be perceived as a net inflow of new capital.
Some of the purchases aremirroring the close of old bearish rates.
4. But institutional demand is still present
Another important player appeared literally today.
Strategy bought Bitcoin again.
The company acquired950 BTC for about $75.7 million, paying an average of about $79,670 per coin.
After the deal, Strategy increased its inventories to:
846 000 BTC
The average purchase price of the entire accumulated volume is about $75,416.
This is a significant volume.
But here it is important not to exaggerate.
$75.7 million by itself cannot explain the movement of Bitcoin by several thousand dollars.
The meaning of this purchase is different.
It shows thatlarge corporate holders continue to use kickbacks to increase BTC exposure.
That is, the market receives an additional signal:
large capital has not disappeared.
5. What do whales do?
Here the situation is much more interesting and less unambiguous.
The data on large addresses does not show a picture of the total purchase of Bitcoin.
According to on-chain analytics, addresses with a balance of at least 1,000 BTC increased positions by about17,258 BTC in the last week, however, the broader figure for addresses with 1,000 BTC and above for the month remains mixed.
This is an important nuance.
This is not to say that the entire market rushed to buy Bitcoin at the same time.
On the contrary, some long-term holders use growth to lock in profits.
But so far this volume of supply has been successfully absorbed by the market.
And this is perhaps one of the most important signals of the current movement.
6. Why is Bitcoin growing even after the Fed's rate hike?
At first glance, there is no logic at all.
The Fed recently raised the rate by 25 basis points.
For Bitcoin, this is traditionally a negative factor: higher rates mean more expensive money and less comfortable liquidity conditions.
CoinShares pointed to this risk as early as September 18: the Fed's tougher rhetoric and lack of expected monetary easing worsened the backdrop for Bitcoin.
But now the market is looking not only at the Fed.
Today, something else is happening.
Oil is falling.
Brent declined by about 2.6% on September 21, as the market began to lay the groundwork for the recovery of part of oil supplies. The fall in oil reduces inflationary pressure and at the same time reduces fears about further tightening of monetary policy.
As a result:
oil ↓ → inflation risks bond ↓ → yields get a respite → risk-on ↑ → bitcoin ↑
That is why the current momentum cannot be viewed exclusively through the prism of the crypto market.
7. Bitcoin again behaves like a risk asset
Another important element of today's movement is generally outside of cryptocurrencies.
On September 21, the following are growing at the same
american futures;
european stocks;
technology sector;
semiconductor companies;
cryptocurrencies.
Reuters notes that the global risk-on is supported by the growth of the technology sector and the decline in oil prices. Nasdaq futures added about 1.1% and S&P 500 futures added about 0.7%.
This is important.
Bitcoin is not moving in a vacuum right now.
It is embedded in the global capital flow:
Tech → Nasdaq → risk assets → crypto.
That is why today's movement looks much wider than just a local BTC pump.
8. There is another unexpected factor: tokenization
On September 17, the US SEC announced temporary exemptions that allow certain platforms to experiment with trading tokenized shares of US companies directly in the blockchain environment.
This decision does not directly mean “the SEC has authorized Bitcoin.”
But it reinforces the overall institutional narrative around blockchain infrastructure.
For large financial players, the boundary between traditional markets and blockchain is gradually becoming less rigid.
And the market is able to perceive such news as an additional argument in favor of the development of crypto infrastructure.
9. Why was the movement so fast?
If you put all the factors together, you get a fairly clear chain.
Step 1
Bitcoin drops to $75,000.
Step 2
Sellers do not receive a continuation of the decline.
Step 3
ETF flows turn in a positive direction.
Step 4
BTC returns $80,000.
Step 5
The resistance breaks through about $82,000-83,000.
Step 6
The mass closure of the shorts begins.
Step 7
Liquidations turn into an additional stream of purchases.
Step 8
Against the backdrop of rising stocks and declining oil, the overall risk-on is increasing.
Step 9
Bitcoin passes $85,000.
That's why today's chart looks almost vertical.
Who is really paying for this growth?
This is perhaps the main question.
Answer:more than one player.
Now we see several sources of demand at the same time:
Source | What's happening |
|---|---|
Bitcoin ETF | Demand returned after strong outflows |
Strategy | I bought 950 BTC for $75.7 million |
Spot buyers | Absorb the supply of long-term holders |
Short squeeze | Hundreds of millions of dollars of shorts are forcibly closed |
Macrophone | Reducing oil improved risk sentiment |
Derivatives | The resistance breakdown accelerated the movement |
Corporate capital | The accumulation of BTC by individual companies continues |
But there is a very important caveat.
Today's $85,000 cannot be explained by ETFs alone.
If only ETFs were the cause, we would expect a much more robust series of large daily inflows.
Now we see the combinationreal demand and forced demand.
It was the second component that made the movement so sharp.
What do analysts say?
Fresh market comments are pretty well matched.
IG analyst Chris Beauchamp notes that the crypto market is supported by the return of capital flows and the decline in oil prices.
Zaye Capital Markets' Naim Aslam attributes the move to stronger ETF inflows, improved sentiment and the closing of bearish positions.
At the same time, analysts emphasize an important thing:the market has not yet got rid of macro risks.
The Fed remains tight, US bond yields remain high, and the geopolitical situation is capable of lifting oil and yields again.
That is, Bitcoin has now received a powerful impetus, but its further stability will depend onwill forced demand turn into sustained spot demand.
Another factor: the options market
On September 25, a large volume of Bitcoin and Ethereum options will expire on Deribit.
According to the Deribit calendar, only Bitcoin contracts with an expiration on September 25 have an open interest around$15.2 billion.
This means that the current week may be particularly interesting for BTC.
A large volume of derivatives can strengthen movements around key price levels.
Therefore, after such an impulse, the volatility may remain elevated.
What will be the main test for Bitcoin next?
Now the situation is fundamentally different from what it was a few days ago.
Bitcoin is no longer trying to break through $80,000.
It is locatedabove $85,000and the market has to prove that this level can become a new zone of price acceptance.
The main question now sounds different:
“Who bought Bitcoin today?”
And so:
“Will they continue to buy after the shorts have been eliminated?”
If ETFs continue to show steady positive flows, spot demand persists, and long-term holders do not begin to dramatically increase sales, the current momentum will receive fundamental confirmation.
If inflows weaken, and the market begins to live solely on new credit positions and derivatives, the likelihood of sharp pullbacks will increase.
Main conclusion
Bitcoin is now growing not becauseone country suddenly decided to buy BTCand not becausebillions of dollars came into ETFs at once.
The picture is much more interesting.
The market first received real demand from institutional participants. Then BTC broke through the key resistance. After that, the derivatives market joined the movement, where hundreds of millions of dollars of short positions were forcibly closed. In parallel, oil prices decreased and the global risk sentiment improved.
The result is a self-sustaining chain:
ETF + institutional demand → breakout → short squeeze → new purchases → acceleration BTC.
That is why the movement on the chart looks like a real "takeoff into space".
But now the more difficult part begins.
In order for the movement to continue, the market will no longer need a short squeeze, but a real steady spot demand.
Where to trade Bitcoin?
If you want to track the movement of BTC and other crypto-currency instruments against the background of changes in capital flows, macroeconomics and the activity of institutional players: