
Bitcoin September 14, 2026: where to look for BTCUSD purchases
Bitcoin enters the new week under the pressure of several macroeconomic factors. Expectations of tighter central bank policies are rising in the market, government bond yields are rising, and investors are reducing their positions in risky assets.
At the time of preparation of the analysis, BTC is trading around$77 590After a recent rise above $80,000, the cryptocurrency failed to gain a foothold at the highs and moved to a correction.
The main question for traders now is not whether bitcoin can continue to decline, but whetherat what levels does the purchase become more attractive in terms of the ratio of risk and potential return.
Macroeconomics puts pressure on Bitcoin
The main factor for the crypto market remains the cost of money.
The market expects that the US Federal Reserve can tighten monetary policy at the next meeting. The probability of a rate hike is estimated at about 86–87%. The reason was more stable inflation indicators and an increase in oil prices above $100 per barrel.
For Bitcoin, this is a negative factor for several reasons:
the yield of bonds increases;
the dollar receives support;
the cost of borrowed capital is growing;
investors are becoming more cautious about risky assets.
At the same time, the European market is also facing rising rates. The ECB recently raised the key rate to 2.5%, and representatives of the regulator allow further tightening of policy due to persistent inflation and rising energy prices.
For cryptocurrencies, this means a reduction in global liquidity. When money becomes more expensive, capital is more often channeled into bonds, the money market, and defensive instruments rather than high-risk assets.
What's happening with Bitcoin ETFs
One of the most important indicators of institutional demand remains the US Bitcoin spot ETFs.
According to Farside Investors, the market was still showing strong inflows in early September, with a cumulative inflow to US BTC-ETFs of around$730.8 million, and on September 4, around$174.6 million. However, then the situation changed.
From 8 to 11 September, mainly outflows were recorded:
September 8: around–$46.6 million;
September 9: around–$120.2 million;
September 10: around–$282.7 million;
September 11: around–$13.2 million.
The cumulative outflow over these four trading days was approximately$462.7 million.
This does not automatically mean the start of a new long-term bearish trend. However, the data show that institutional demand has not yet confirmed a robust continuation of growth.
Previously, strong inflows into ETFs supported the recovery of bitcoin after a decline.Now the market is in a situation where the price is growing weaker, and large capital begins to fix profits or reduce exposure.
For the buyer, this means: for now, it is better to look not for the entrance on emotions, but for areas where sellers can lose the initiative.
Key levels of Bitcoin purchases
On the presented BTCUSD H2 chart, the current price is around$77 590.
The red levels at the top indicate the nearest resistance zones:
$78 411;
$79 006;
$79 602.
The blue levels at the bottom form the main areas of potential demand:
$76 028;
$75 429;
$74 837.
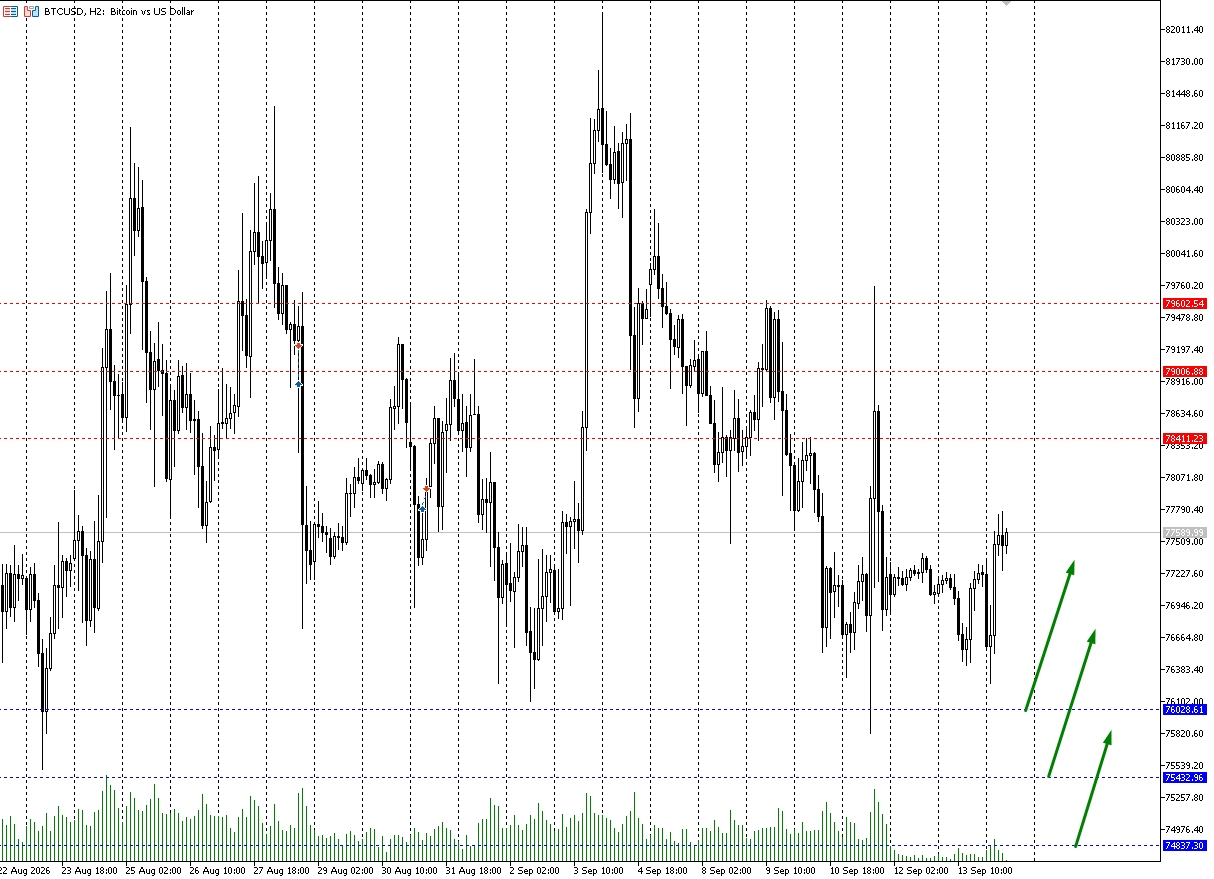
Bitcoin's key levels as of September 14, 2026. Red lines show resistance zones, blue lines indicate potential areas of customer interest.
Zone 1: $76,000-$76,100
The first area of interest is around$76 028.
This is the closest support level after the current decline. If Bitcoin continues to correct, this is where the first reaction of buyers may appear.
Purchasing in this area makes sense only if there is confirmation:
slowing the decline;
forming a reversal candle;
retention of the level after the retest;
decrease in sales.
If the price simply breaks through $76,000 with a strong bearish candle, you should not enter immediately. In this case, the level stops working as support and the market may go lower.
Operating scenario:observe the reaction of BTC in the range of$75,900- $76,100 and consider partial entry only after confirmation.
Zone 2: $75,400-$75,500
The second area is located around$75 429.
This is a deeper area of correction, which may become more interesting for a medium-term buyer. Here, the risk/reward ratio potentially improves, as the distance to the nearest resistances remains large enough.
If the price drops to the area of $75,400 and begins to form a local base, you can consider this range as the main area for shopping.
It is especially important that sellers are not able to gain a foothold below the level on several H2 candles. A sustained close below $75,400 would signal weakening support.
Zone 3: $74,800-$74,900
The deepest of the designated zones is around$74 837.
This is the level for a stronger correction scenario. If bitcoin loses $76,000 and $75,400, the next area of interest may be in the region of $74,800.
For a long-term buyer, this zone may be the most interesting of the three marked levels.However, a potentially more favorable price is accompanied by a greater risk: falling below this area can open the way to further decline.
Important:you should not use all the capital at the first level. It is much more reasonable to distribute the volume between several zones and to determine in advance the maximum allowable loss.
Where to buy bitcoin: scenarios for September 14
Scenario 1 - $76,000 withholding
If BTC adjusts to $76,000 and quickly returns above the level, this may be the first sign of demand.
In this case, the immediate recovery goals are:
$78 411;
$79 006;
$79 602.
However, to confidently continue to grow, Bitcoin needs to return the area above $79,000 and gain a foothold over it.
Scenario 2: Deeper correction
If the $76,000 level is not held, attention shifts to $75,400 and $74,837.
This scenario may be more attractive to buyers who do not want to enter the market after a strong impulse and prefer to wait for a decline.
At the same time, the breakdown of all three blue levels will mean that the current demand structure is broken. In such a situation, it is better not to try to guess the bottom.
Scenario 3: Refund above $79,000
If bitcoin quickly returns above $79,000 and shows a steady anchorage, the bearish scenario weakens temporarily.
Breakdown and retention of the $79,000-$79,600 zone can open the way to retesting the $80,000 and above area.
But buying immediately after a sharp impulse up is riskier than waiting for a correction to the broken level.
Why you should not buy the entire volume at once
The current market situation remains uncertain.
On the one hand, Bitcoin retains the potential for recovery, and the August inflows into ETFs show that the institutional interest in the asset has not completely disappeared. On the other hand, the latest ETF data shows capital outflows, and rising bond yields and expectations of rate hikes put pressure on risky assets.
Therefore, the optimal tactic for a cautious trader is a phased entry:
Zone | Level | Role |
|---|---|---|
First Support | $76 028 | Observation of the first reaction of buyers |
Main area | $75 429 | Possible area for partial purchase |
Deep Zone | $74 837 | Interest with a strong correction |
Resistance | $78 411 | First Level of Recovery |
Resistance | $79 006 | Key Buyer Strength Verification Area |
Upper resistance | $79 602 | Possible yield to $80,000 |
What to track next
In the coming days, Bitcoin may be affected not only by technical levels, but also by the following events:
Fed decision.Any signal of further policy tightening could strengthen the dollar and put pressure on BTC.
US bond yields.Their growth usually worsens the conditions for risky assets.
Flows in Bitcoin ETFs.The return of steady daily inflows will be a positive confirmation of demand.
Oil and inflation.Expensive oil increases the likelihood of maintaining tight monetary policy.
Dollar dynamics.A strong dollar often puts additional pressure on cryptocurrencies, especially during periods of declining liquidity.
Where to practice Bitcoin trading
If you want to independently monitor BTCUSD levels, test trading scenarios and work with the cryptocurrency market, this can be done throughAvora Markets.
For this article, it is better to place the affiliate link in this block, after analyzing the levels and scenarios.By this point, the reader has already received practical benefits, understands the possible entry zones and naturally proceeds to the question of where to track the market and apply the ideas received. This is a more effective place to click than the link at the very beginning of the article.
Main conclusion
As of September 14, 2026, Bitcoin is in a zone of increased uncertainty. The current price of about $77,590 is located between the nearest resistances of $78,411- $79,602 and the key support zones of $76,028, $75,429 and $74,837.
The most interesting strategy now is not to chase the price, but to wait for the market reaction to the indicated levels.
Main area for observation: $76,000-$75,400.
Deeper area of interest: about $74,837.
At the same time, the macroeconomic background remains difficult: high bond yields, expectations of Fed rate hikes, oil growth and weakening inflows into Bitcoin ETFs limit the potential for a rapid recovery.
Bitcoin may continue to grow, but for a sustainable bullish scenario, the market needs to see the return of institutional demand and consolidation above the $79,000- $80,000 zone.