
Bitcoin is approaching a moment that is able to determine the direction of the next movement.
After descending to the area$57 742price recovered and returned to the zone$77 000–80 000.
But this is where the main struggle between buyers and sellers begins.
$80,000 — the boundary between recovery and new momentum
The chart clearly shows that the $80,000 area was already an important point for the market.
As long as Bitcoin is below it, growth remains a recovery after a correction.
Fixing above the resistance will change the picture.
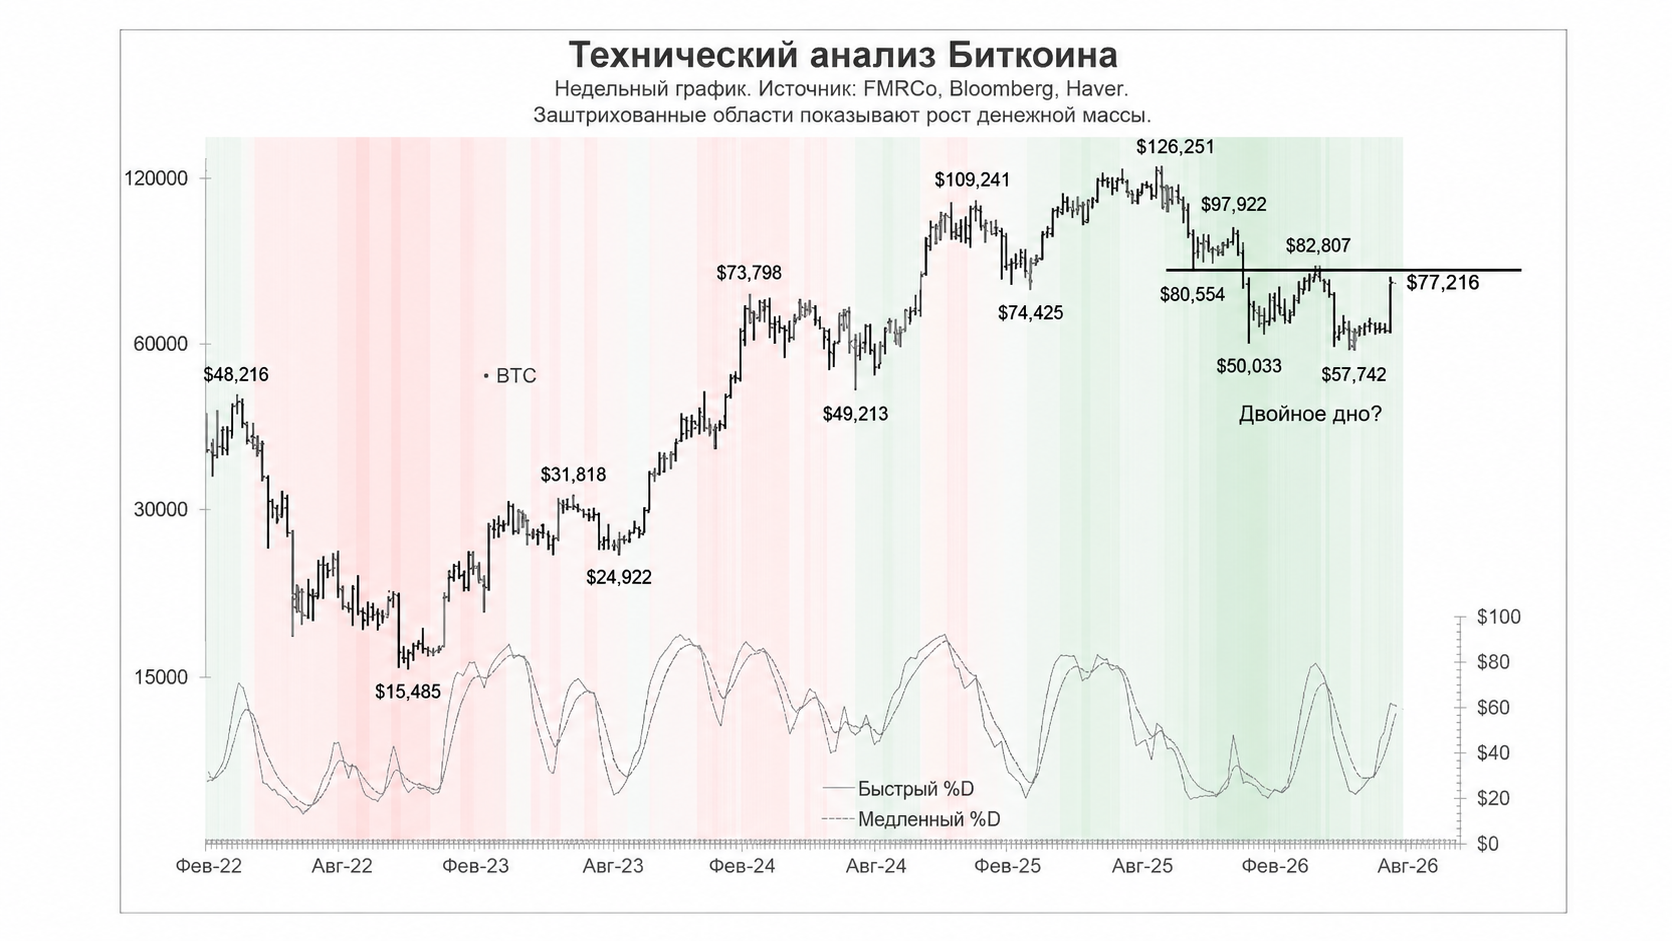
Weekly technical analysis of Bitcoin. Potential double bottom and key resistance zone around $80,000. Source: FMRC, Bloomberg, Haver.
What the structure shows
The first minimum was formed much earlier, the second — about$57 742.
Between them, the market tried to recover several times, but the zone of about $80,000 remained a serious barrier.
So now there are two scenarios.
Bullish:Bitcoin breaks through $80,000 and consolidates higher. Then the double bottom is confirmed, and the probability of continuing recovery increases.
Bearish:price again gets the rejection of resistance. In this case, the market may return to looking for support at the bottom of the range.
Why liquidity is important
The bottom of the chart shows the cash liquidity cycles. Historically, periods of money supply expansion have created a more conducive environment for risky assets.
This does not guarantee the growth of Bitcoin, but reinforces the value of the current technical signal:if the liquidity improves at the same time as the resistance breaks, the movement may receive additional fuel.
Main conclusion
Bitcoin is not just near the round mark.
$80,000 is a key level of confirmation of the current recovery.
While there is no breakout, the double bottom remains only a potential formation.
Anchoring above $80,000 will be a much stronger signal for continued growth.