
Auto Fibo Indicator for MT5: Fibonacci without manual chart marking
Fibonacci remains one of the most popular technical analysis tools. But there is a problem familiar to almost every trader:With each new market movement, you have to manually search for extreme points and rebuild the Fibonacci grid.
In a calm market, this takes a few seconds. On gold, indices or cryptocurrencies, when the price moves quickly, the situation is completely different.
This is where it can come in handyAuto Fibo Indicator for MetaTrader 5.
The indicator automatically displays Fibonacci levels on the chart, allowing the trader to quickly see key price zones and not waste time on constant manual marking. IndicatorSpot distributes Auto Fibo for MT5 as a free indicator.
DOWNLOAD AUTO FIBO INDICATOR FOR MT5 FOR FREE
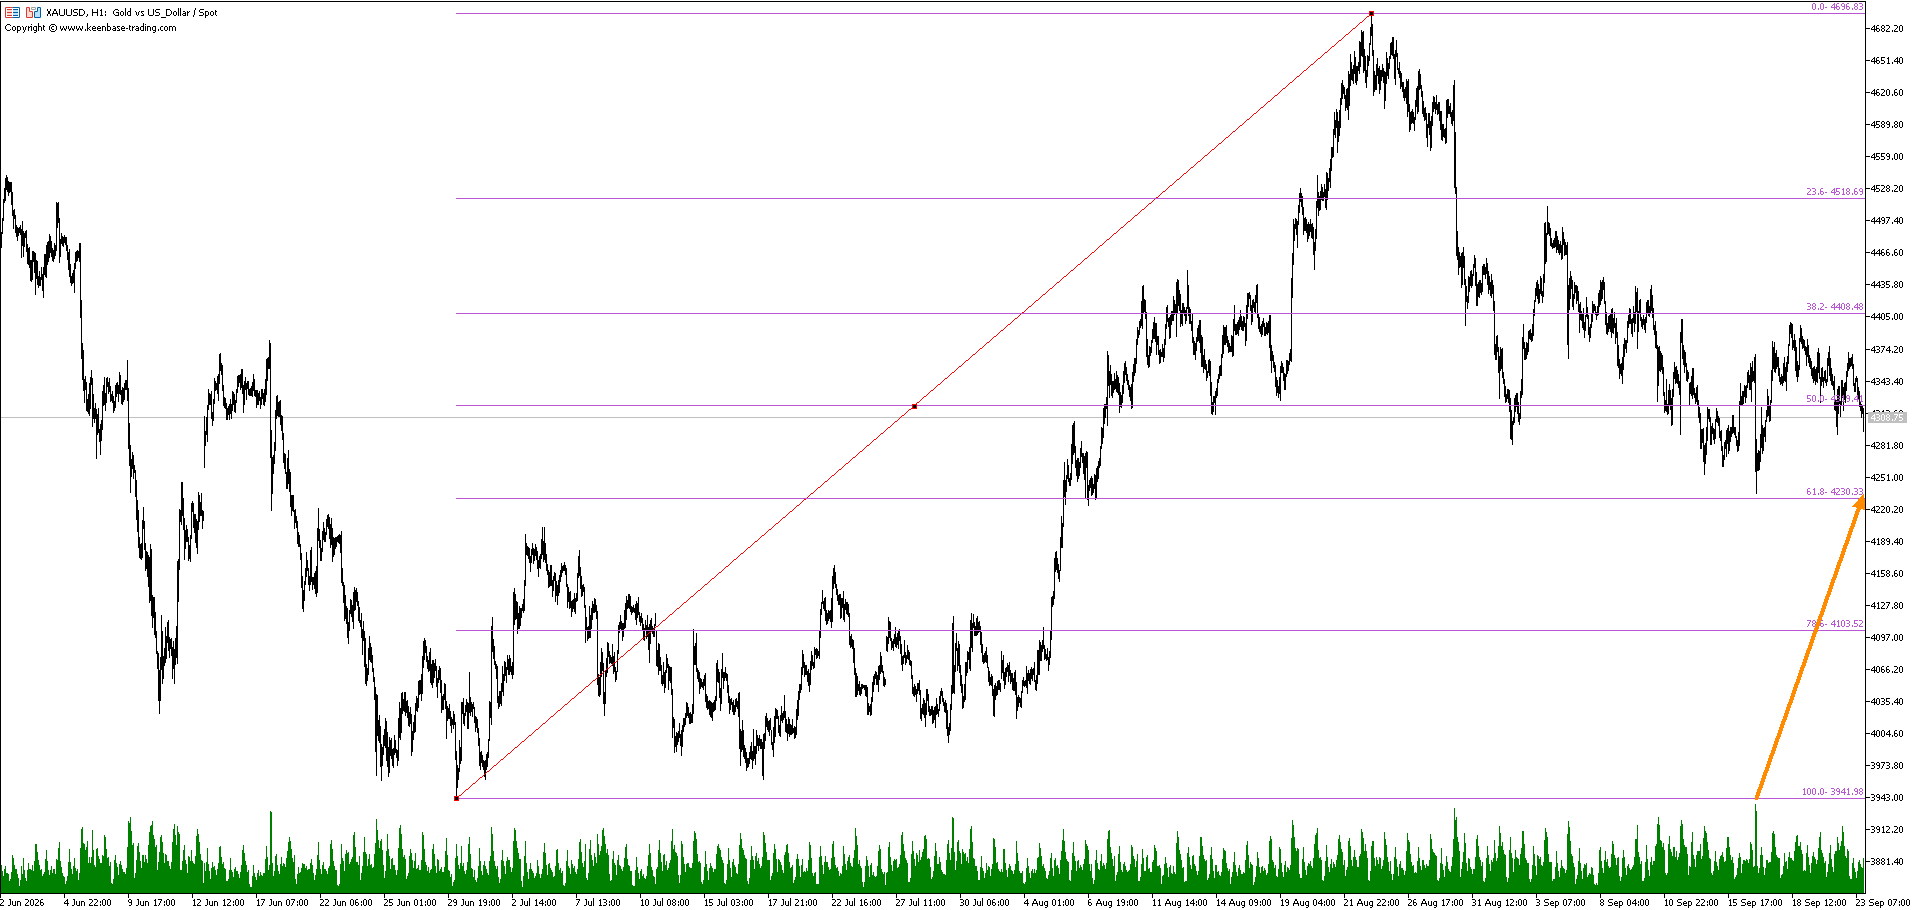
Auto Fibo Indicator on XAUUSD H1 chart with automatic Fibonacci levels.
What is Auto Fibo Indicator for MT5?
Auto Fibo Indicatoris a tool for MetaTrader 5 that is designed to automatically display Fibonacci levels on a price chart.
Instead of each time independently selecting points for constructing Fibonacci Retracement, the trader receives a ready-made grid of levels directly on the chart.
This is especially convenient when analyzing a large number of instruments.
For example:
XAUUSD;
XAGUSD;
EURUSD;
GBPUSD;
USDJPY;
oil;
stock indices;
cryptocurrencies;
individual shares.
The main idea is simple:less manual work, more attention to the price movement itself.
It is important to understand: Auto Fibo is not an independent trading system and does not guarantee a price reversal at any level.
It shows the levels. The trader makes the decision to enter independently.
Why are Fibonacci levels so popular in trading?
Fibonacci is used because after a strong movement the price does not always continue to move in a straight line.
The market can make an impulse, then roll back part of the movement and only then continue in the main direction.
It is precisely these corrections that are attempted to be analyzed using Fibonacci Retracement.
The most famous levels:
Level | What is usually analyzed |
|---|---|
23.6% | shallow correction of a strong impulse |
38.2% | common retracement zone |
50% | average correction area |
61.8% | one of the most famous Fibonacci levels |
78.6% | deep correction |
100% | return to the starting point of movement |
In your Auto Fibo settings, the indicator displays exactly the grid of such levels, and on the presented XAUUSD charts the levels are visible23.6%, 38.2%, 50%, 61.8%, 78.6% and 100%.
How does Auto Fibo look on a real chart?
On the XAUUSD H1 chart, the indicator forms horizontal Fibonacci levels, which allow you to quickly assess the position of the current price relative to the previous movement.
This is especially clear when the price is between several levels.
For example, instead of asking:
“Where is the price now relative to the previous impulse?”
the trader immediately sees:
23.6% → 38.2% → 50% → 61.8% → 78.6% → 100%.
This turns the chart from just a sequence of candles into a map of potential price zones.
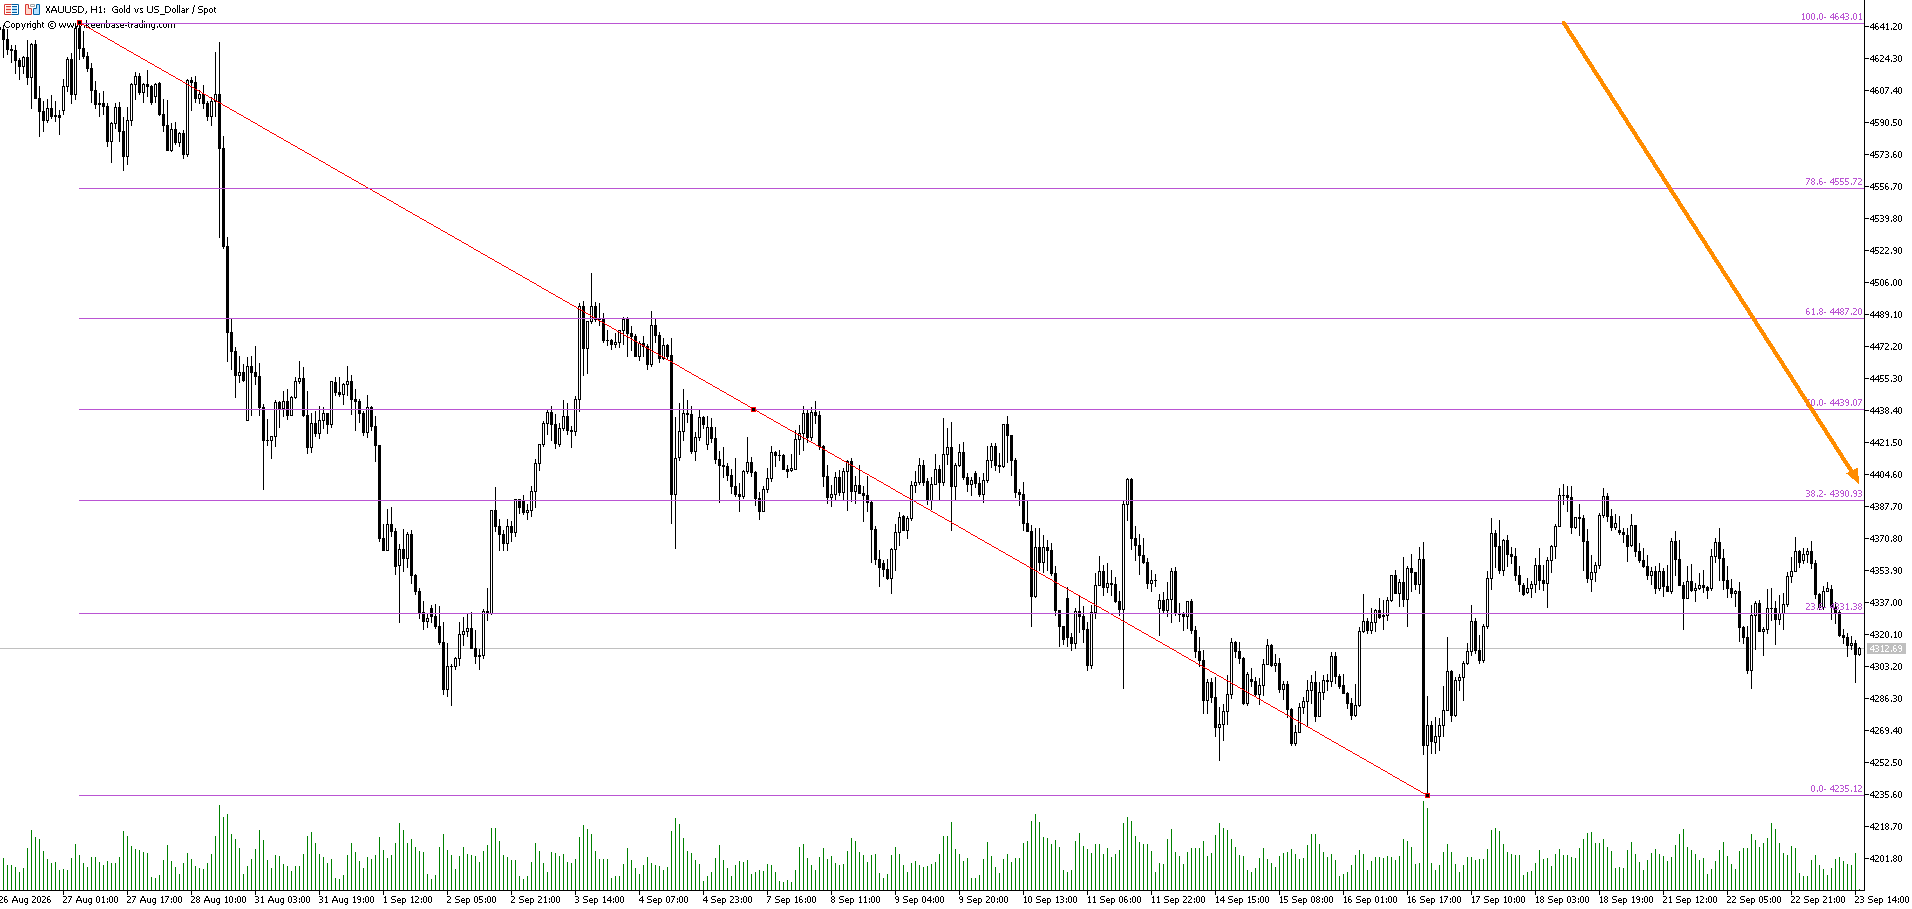
Auto Fibo Indicator on XAUUSD H1. Fibonacci levels help assess the depth of the correction relative to the previous movement.
Auto Fibo on gold XAUUSD practical example
Gold is an interesting instrument to demonstrate Auto Fibo due to the fact that XAUUSD regularly forms pronounced impulse movements and subsequent corrections.
On the presented H1 chart you can see a large movement of gold from the area around3941to the area around4696.
After strong growth, the price began to correct.
It is in this situation that Fibonacci becomes especially interesting.
Instead of perceiving a correction as a chaotic downward move, a trader can view it through the prism of key levels.
The graph shows:
23.6%
38.2%
50%
61.8%
78.6%
100%
At the same time, the levels themselves do not mean that the price will necessarily reverse.
Thisbenchmarks for analysis, and not ready-made trading signals.
What does the 61.8% level show?
Deserves special attention61.8% Fibonacci.
This is one of the most famous levels in technical analysis.
If after a strong impulse the price pulls back to 61.8%, the trader can use this area for further analysis:
is there any reaction from buyers;
whether a reversal candle formation appears;
whether the market structure is changing;
whether volatility is increasing;
whether the level coincides with support or resistance;
whether confirmation appears on a lower timeframe.
This is why Fibonacci should rarely be considered in isolation.
It is better to use the level as part of a trading script, rather than as an automatic Buy or Sell button.
Auto Fibo + Price Action: How to Get More Information
One of the most logical uses of Auto Fibo is to combine levels withPrice Action.
Let's say the price approaches 61.8%.
The level itself does not guarantee anything.
But if at the same time appears:
strong price reaction;
false breakout;
candlestick reversal pattern;
local minimum or maximum;
change in structure;
confirmation on a lower timeframe,
the level then becomes part of a more complete analysis.
This approach allows you to avoid a common mistake made by beginners:
“The price has reached 61.8%, which means you need to buy.”
No.
The price has reached the level. Now we need to seewhat the market is doing at this level.
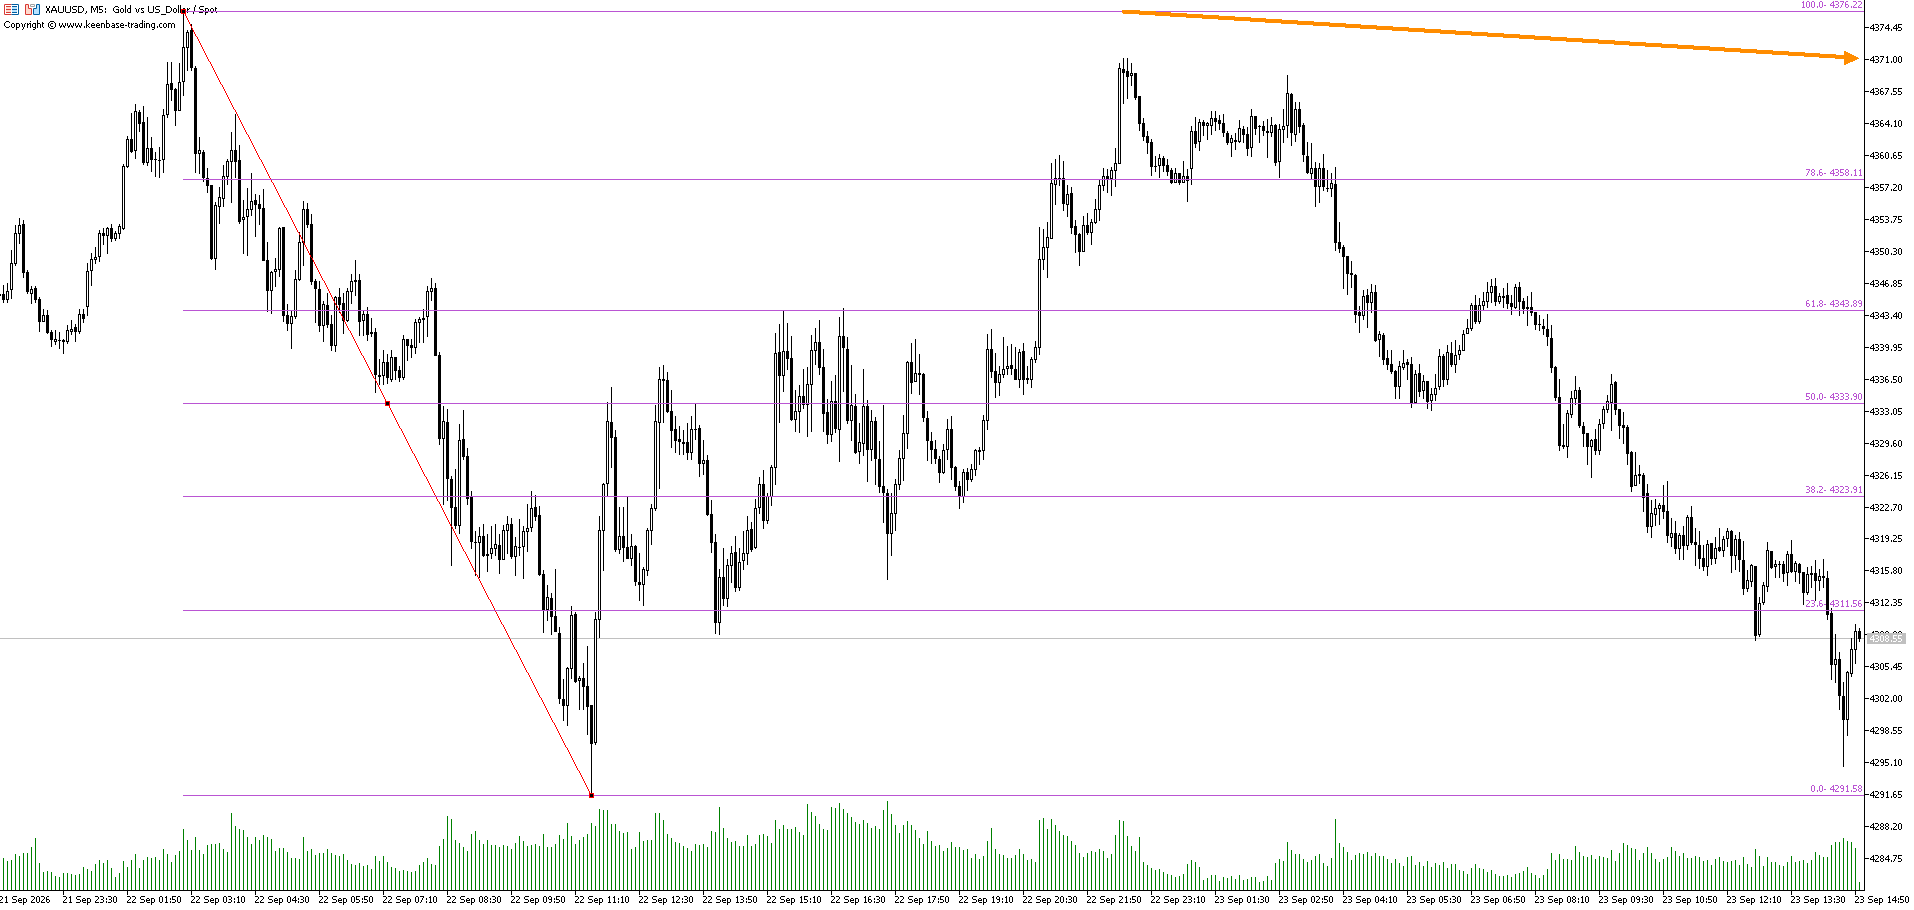
Auto Fibo on XAUUSD M5. Fibonacci levels can be used as reference points to analyze corrections and price reactions.
Auto Fibo Indicator Settings for MT5
The provided settings screenshot uses the following configuration:
Parameter | Meaning |
|---|---|
Fibo Mode | Auto |
Fibo Levels Color | MediumOrchid |
Fibo Levels Style | Solid |
Fibo Levels Width | 1 |
Show Untraced Line | true |
Untraced Line Width | 4 |
Untraced Line Color | DarkOrange |
What does this mean?
Fibo Mode: Auto
The indicator operates in automatic mode.
This is a key setting of Auto Fibo, since the main task of the tool is to automate the construction of Fibonacci.
Fibo Levels Color: MediumOrchid
Defines the color of the main Fibonacci lines.
The configuration provided uses tintMediumOrchid.
Fibo Levels Style: Solid
Level lines appear solid.
This makes the levels clearly visible even with a large number of candles on the chart.
Fibo Levels Width: 1
The thickness of the main lines is set to 1.
Show Untraced Line: true
The additional line is enabled.
On the presented charts it is displayed separately from the main levels.
Untraced Line Width: 4
The thickness of this line is set to 4, so it is visually more noticeable than standard Fibonacci levels.
Untraced Line Color: DarkOrange
For an additional line it is usedDarkOrange.
How to install Auto Fibo Indicator in MetaTrader 5?
Installing a custom indicator in MT5 is usually done through the platform's data directory.
General order:
1. Download the indicator file.
2. Open MetaTrader 5.
3. Go to:
File -> Open Data Directory
4. Open the folder:
MQL5 → Indicators
5. Place the indicator file in this folder.
6. Restart MetaTrader 5 or refresh the Navigator window.
7. Find Auto Fibo in the Indicators section.
8. Drag the indicator to the desired chart.
9. Check the settings and click OK.
After this, the indicator should appear directly on the price chart.
In which markets can Auto Fibo be used?
The main advantage of Fibonacci is that this instrument is not tied to one specific financial market.
Therefore, Auto Fibo can be considered for analysis:
Forex
EURUSD, GBPUSD, USDJPY and other currency pairs.
Gold and other metals
XAUUSD, XAGUSD and other instruments.
Indexes
US30, US500, NAS100, GER40 and other stock indices.
Cryptocurrencies
BTCUSD, ETHUSD and other digital assets.
Commodity markets
Oil and other commodities.
But each market must take into account its own volatility and price movement characteristics.
Auto Fibo for scalping, day trading and swing trading
It is interesting that the same instrument can be used on completely different trading horizons.
Scalping
On smaller timeframes, Fibonacci can be used to analyze short-term impulses and corrections.
For example:
M1 → M5 → M15
In your M5 screenshot you can clearly see how the price consistently passes through the Fibonacci levels during the decline.
Day Trading
For day trading, you can analyze H1 and use M5/M15 to find more precise context.
Swing Trading
On H4 and D1 Fibonacci can be used to analyze larger movements.
Main rule:
the higher the timeframe, the larger the movement that is analyzed.
How to use Auto Fibo in a trading scenario?
A simple algorithm might look like this:
Step 1. Find a pronounced price movement.
First you need to understand what kind of impulse is being analyzed.
Step 2. View Fibonacci location.
Determine where the current price is relative to 23.6%, 38.2%, 50%, 61.8% and 78.6%.
Step 3. Find the price reaction.
Do not enter just because the price has touched a level.
Step 4. Add confirmation.
Use Price Action, support/resistance, market structure or other elements of your trading system.
Step 5. Calculate the risk.
Before opening a position, determine the potential Stop Loss, position size and acceptable risk.
Step 6. Only after this consider the entrance.
This is how Fibonacci turns from a beautiful grid of lines into a full-fledged element of a trading plan.
Can Auto Fibo be used as a trading signal?
No, the indicator itself should not be considered a guarantee of a buy or sell signal.
Auto Fibo shows levels, but the market may:
break through the level;
stop in front of him;
make a false breakout;
complete the level without reacting;
turn around after a deep pullback.
Therefore, Fibonacci is better used ascontext analysis tool.
This is especially important for gold and cryptocurrencies, where strong impulses can quickly pass through several levels in a row.
Free Auto Fibo Indicator for MT5
If you are using MetaTrader 5 and want to automate Fibonacci plotting, Auto Fibo can significantly reduce the number of manual steps.
On the IndicatorSpot page the indicator is presented asfree Auto Fibo Indicator for MT5.
Download for free:
DOWNLOAD AUTO FIBO INDICATOR FOR MT5 FOR FREE
After installation, it is better to first test the indicator on a demo account and see how the levels behave on the selected instruments and timeframes.
Trading through Avora Markets
If you are already using MetaTrader 5 for technical analysis, the next step is obvious: transfer your custom trading algorithm to a live trading environment.
There is also an offer for new customersup to 50% bonus on first deposit and 10% on subsequent deposits, subject to bonus program terms and jurisdiction-specific availability.
Also available for individual instrumentsSwap Free conditions, which may be of interest to traders who hold positions for longer than one trading day.
Auto Fibo Indicator: advantages and limitations
Benefits
automatic Fibonacci display;
less manual work;
convenient visualization of levels;
suitable for MetaTrader 5;
can be used on different instruments;
suitable for different timeframes;
convenient to combine with Price Action;
helps to structure the correction analysis.
Limitations
Fibonacci does not predict the market with 100% accuracy;
the level is not an independent trading signal;
when the market structure changes, the previous grid may lose relevance;
on strong impulses, the price is able to quickly move through several levels;
the indicator does not replace risk management.
Auto Fibo MT5 or Manual Fibonacci?
The main difference is not in the mathematics itself.
Manual Fibonaccigives the trader full control over the choice of construction points.
Auto Fibofocuses on speed and automation.
If a trader regularly analyzes dozens of charts, automation can greatly simplify the workflow.
If the strategy requires very specific swing high and swing low choices, manual marking may still be more convenient.
Therefore, it is logical to consider Auto Fibo not as a replacement for technical analysis, but as a tool that does some of the work faster.